One of the most common metrics used to measure the forecast accuracy of a model is MSE, which stands for mean squared error. It is calculated as:
MSE = (1/n) * Σ(actual – forecast)2
where:
- Σ – a fancy symbol that means “sum”
- n – sample size
- actual – the actual data value
- forecast – the forecasted data value
The lower the value for MSE, the better a model is able to forecast values accurately.
How to Calculate MSE in Excel
To calculate MSE in Excel, we can perform the following steps:
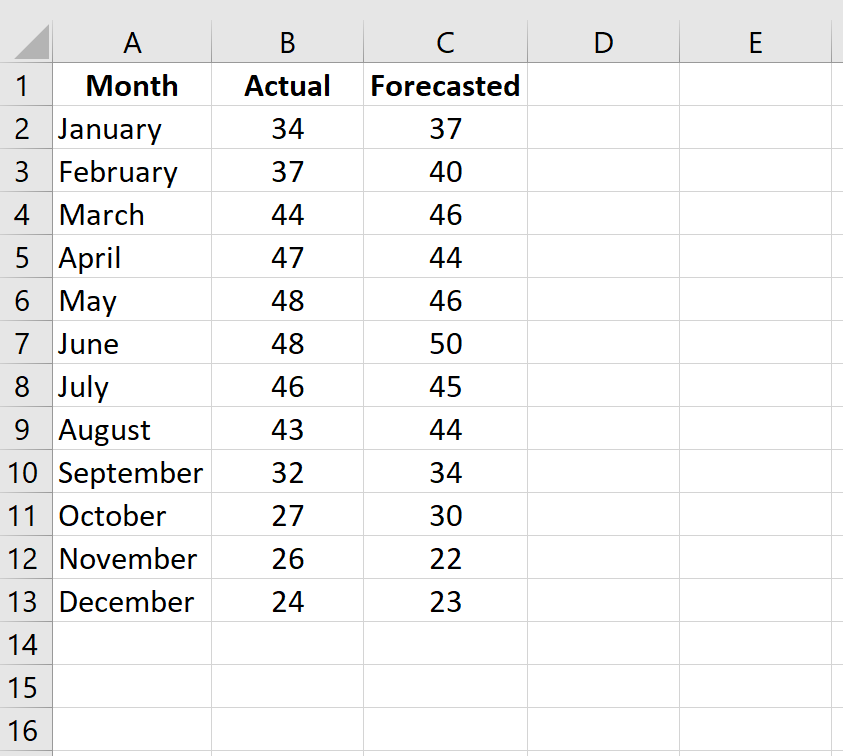
Step 1: Enter the actual values and forecasted values in two separate columns.
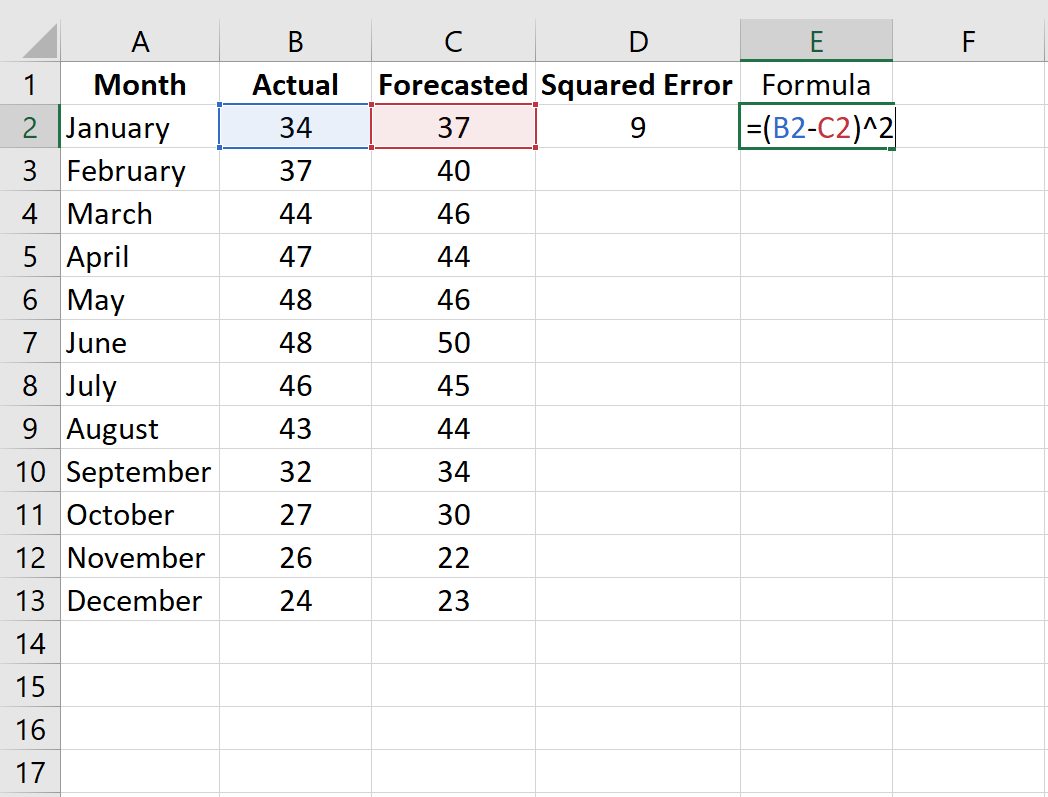
Step 2: Calculate the squared error for each row.
Recall that the squared error is calculated as: (actual – forecast)2. We will use this formula to calculate the squared error for each row.
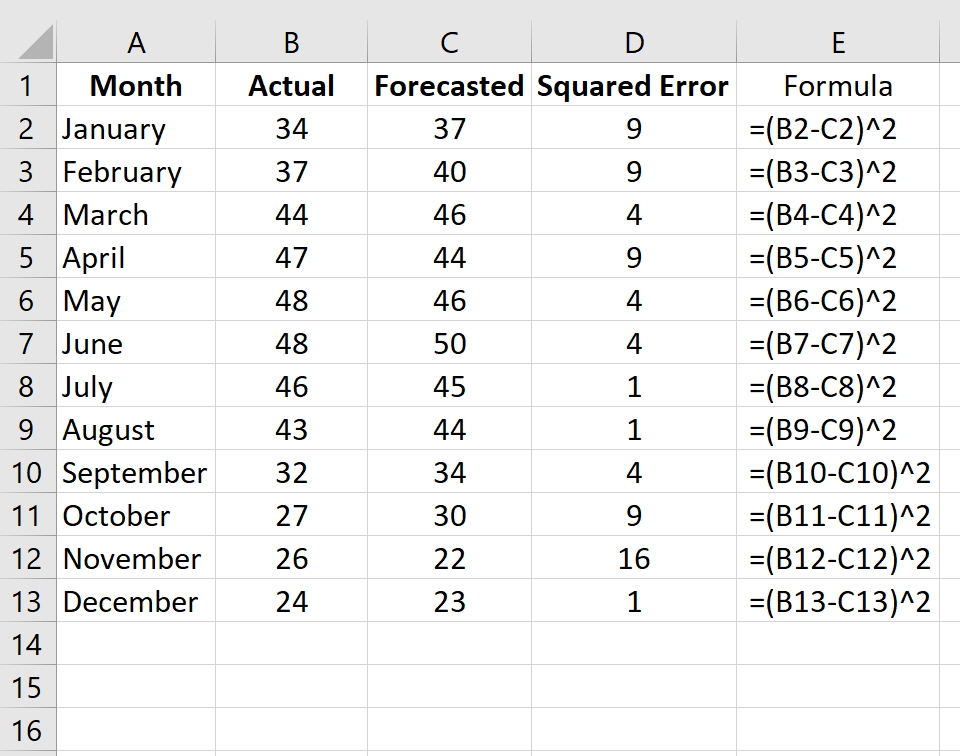
Column D displays the squared error and Column E shows the formula we used:
Repeat this formula for each row:
Step 3: Calculate the mean squared error.
Calculate MSE by simply finding the average of the values in column D:
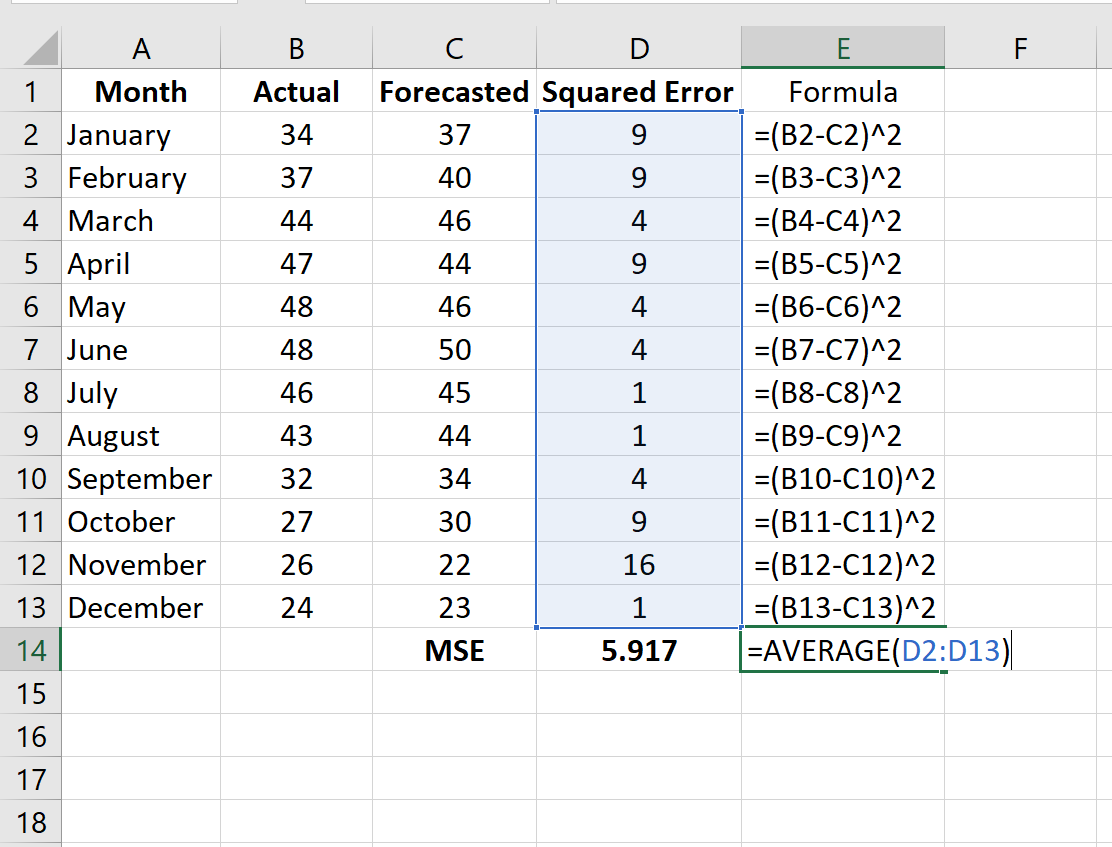
The MSE of this model turns out to be 5.917.
Additional Resources
Two other popular metrics used to assess model accuracy are MAD – mean absolute deviation, and MAPE – mean absolute percentage error. The following tutorials explain how to calculate these metrics in Excel:
How to Calculate Mean Absolute Deviation (MAD) in Excel
How to Calculate Mean Absolute Percentage Error (MAPE) in Excel