You can easily chart data from multiple sheets in Google Sheets by simply adding multiple ranges for Series in the Chart editor panel.
The following step-by-step example shows how to do so.
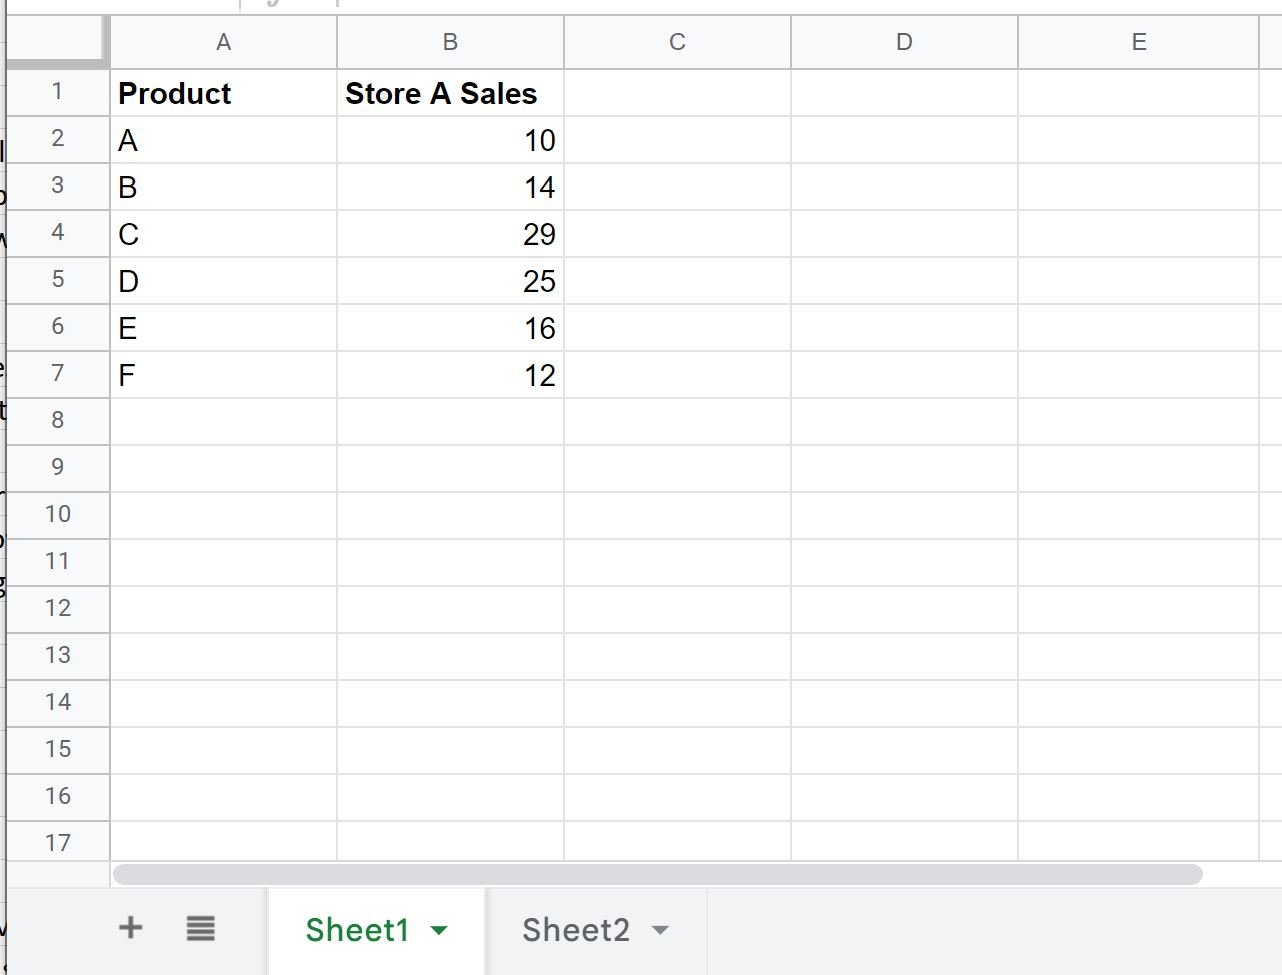
Step 1: Enter the Data
First, let’s enter the following dataset into Sheet1 that shows the sales of various products at Store A:
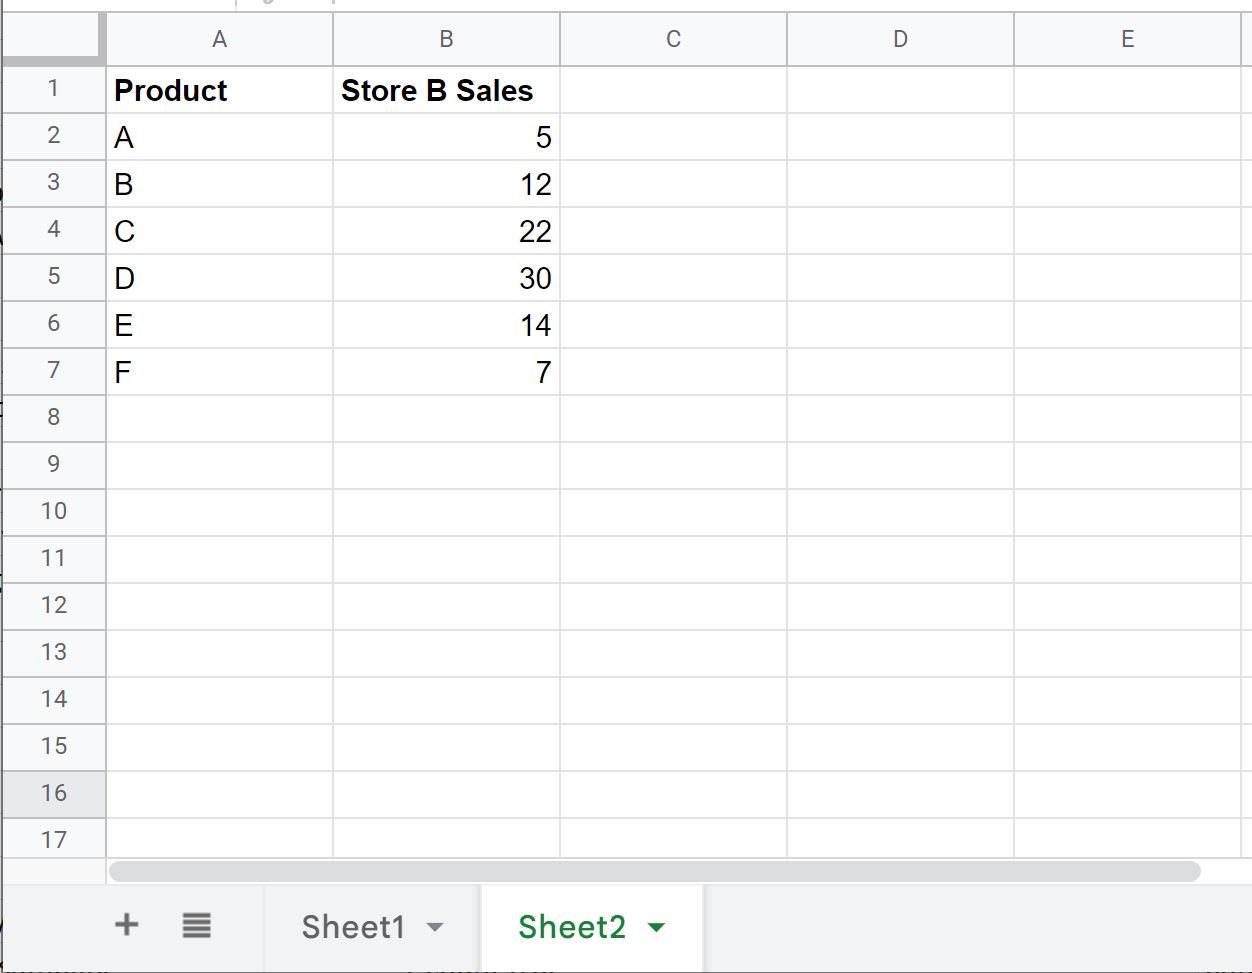
Next, we’ll enter the following dataset into Sheet2 that shows the sales of the same products at Store B:
Step 2: Create Initial Chart
Next, we’ll highlight the range A2:B7 in Sheet1, then click the Insert tab, then click Chart:
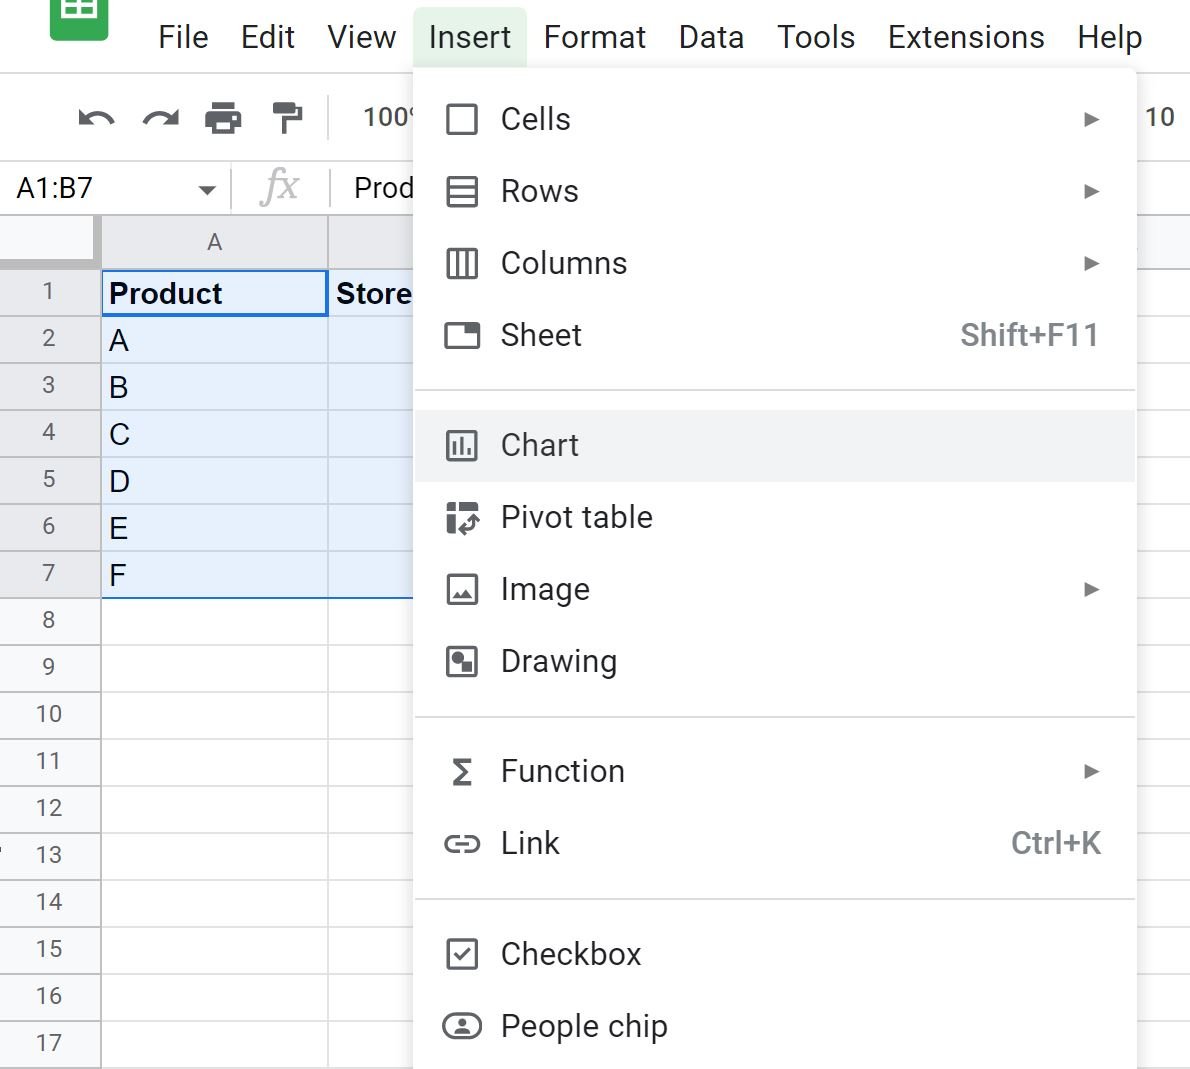
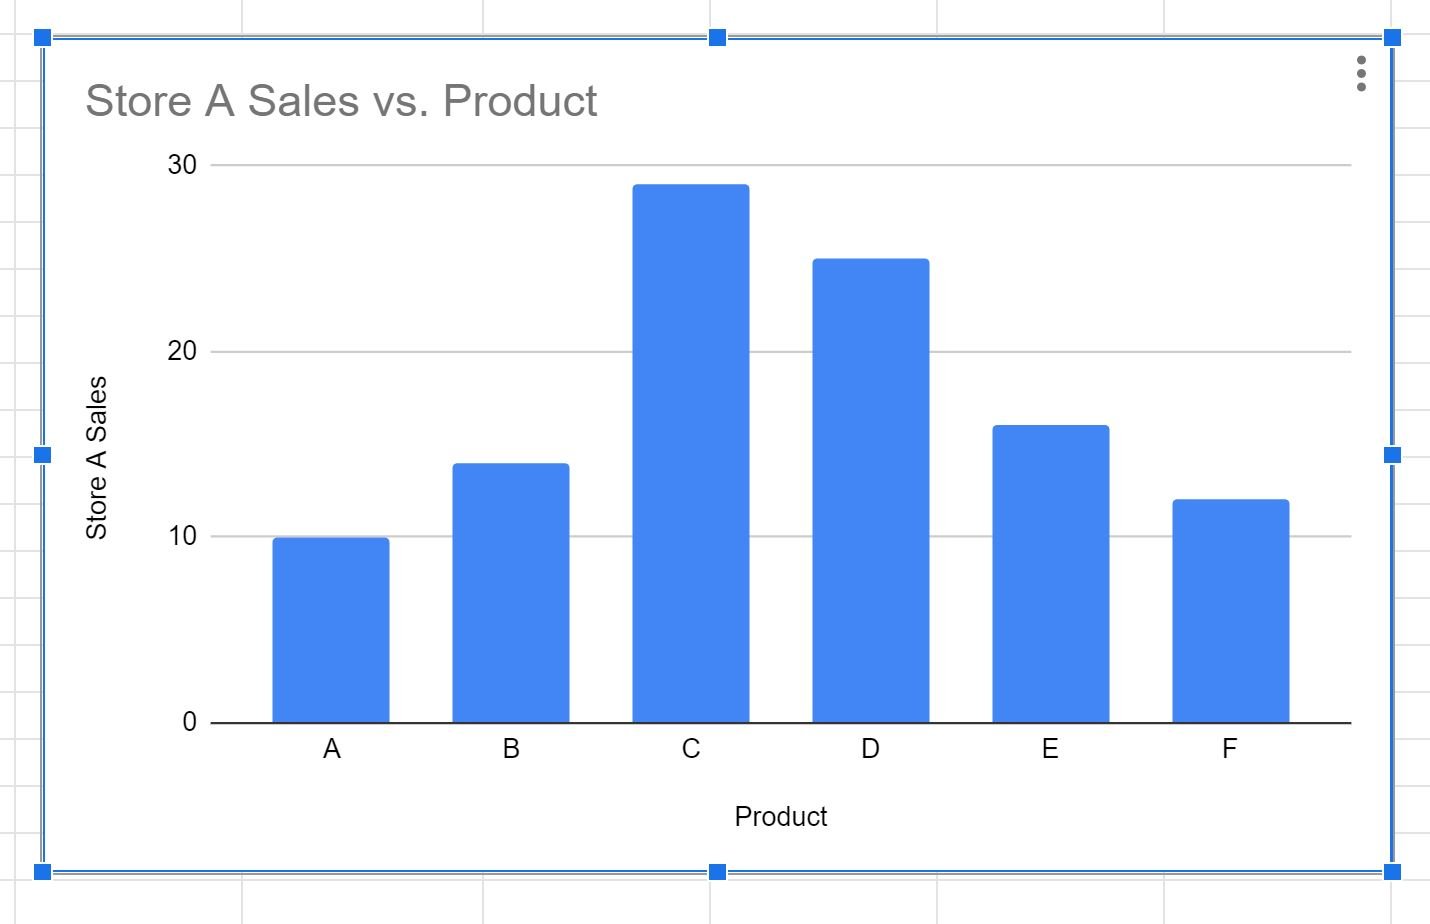
In the Chart editor panel that appears, we’ll choose Column chart as the Chart type:
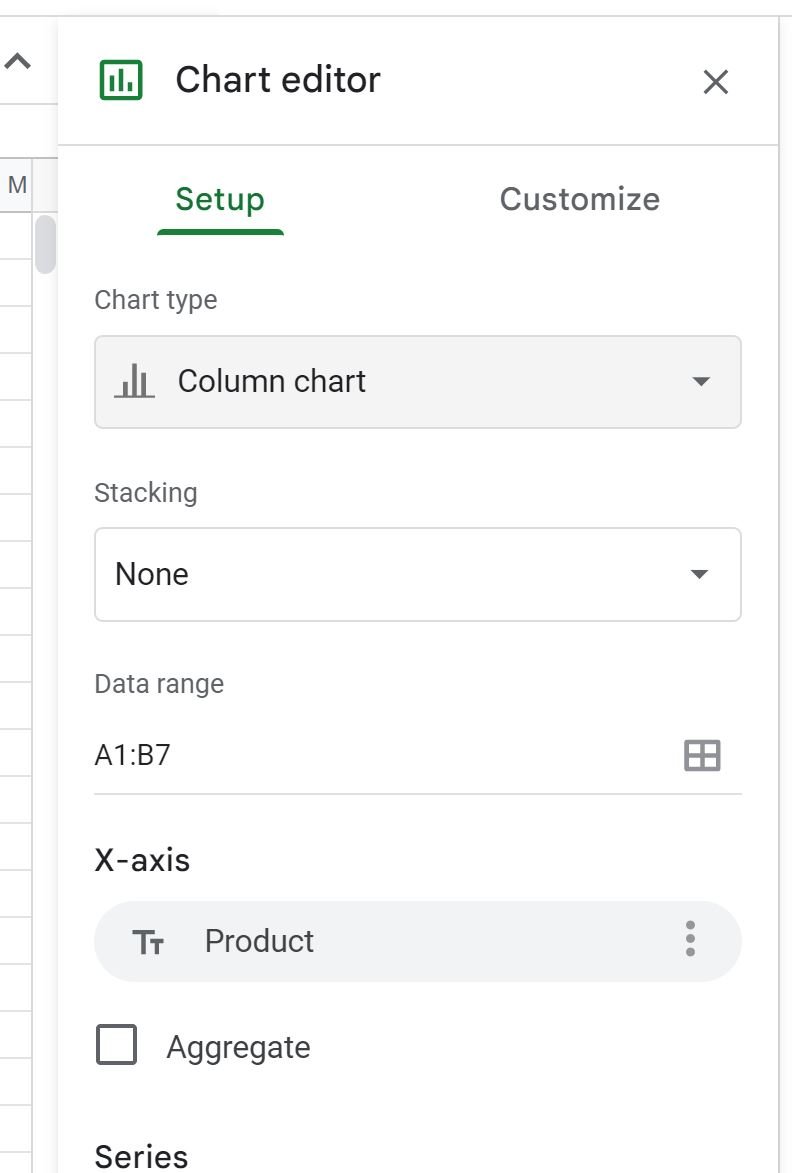
This will produce the following chart that shows the sales of each product from Sheet1:
Step 3: Add Data from Second Sheet to Chart
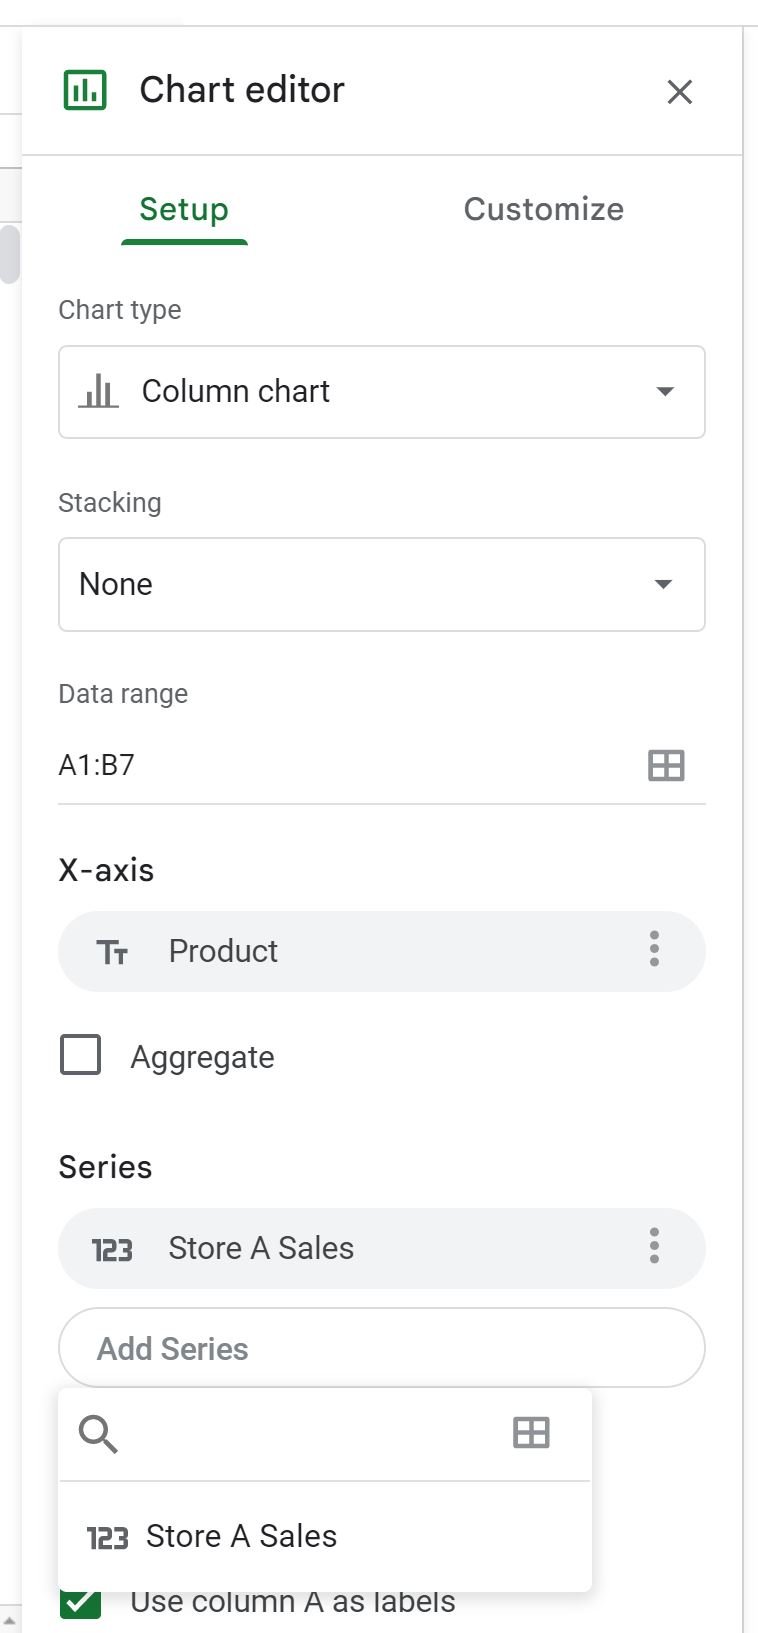
To add the sales data from Sheet2 to the chart, click Add Series from the Setup tab within the Chart editor panel, then click the tiny grid icon:
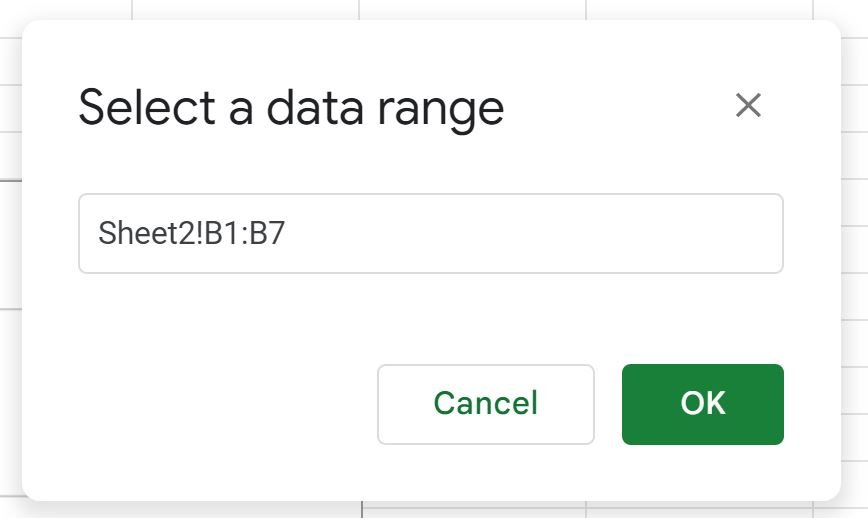
In the new window that appears, type Sheet2!B1:B7 for the data range:
Once you click OK, the sales data from Sheet2 will be added to the chart:
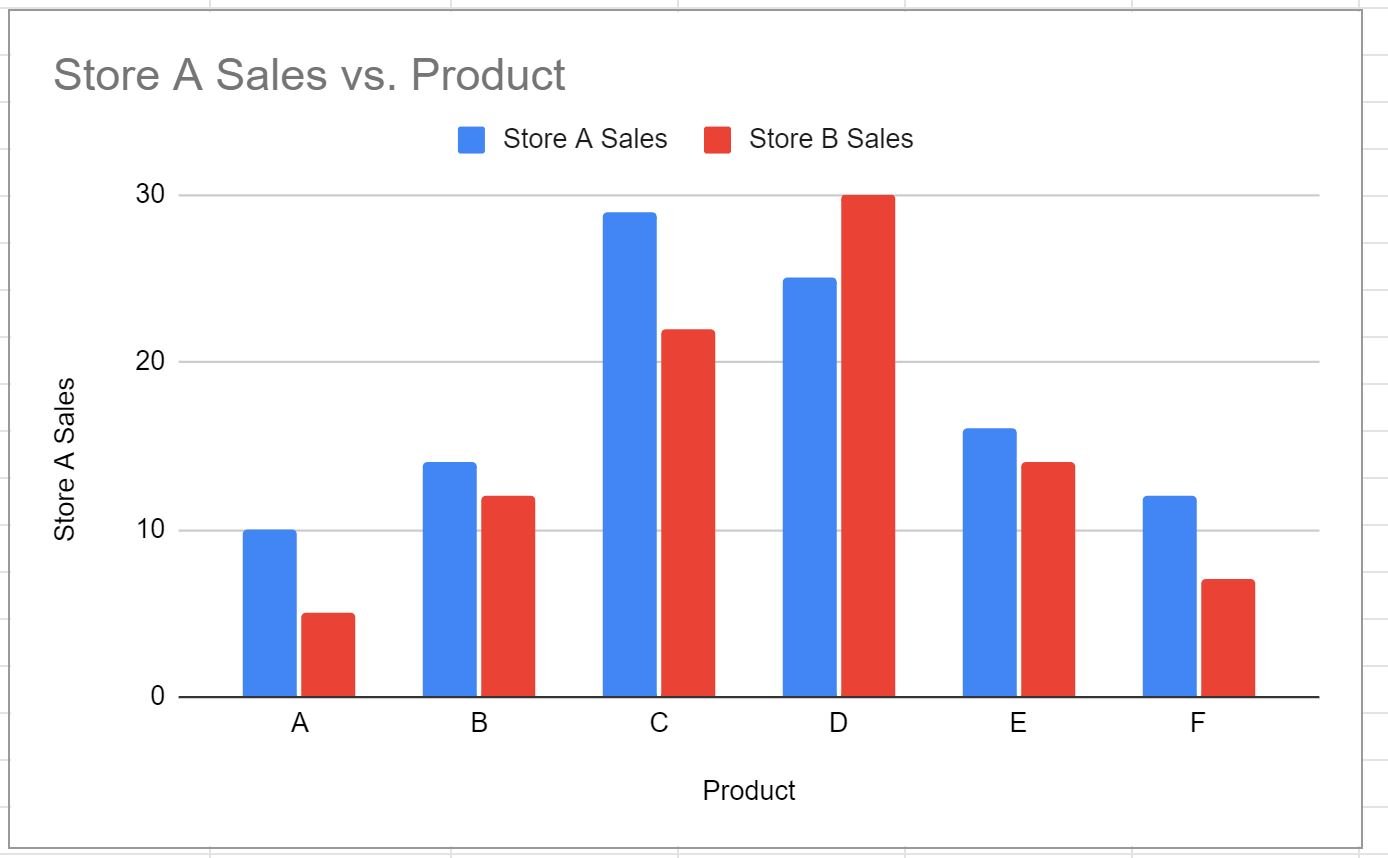
The blue bars represent the sales of each product from Store A and the red bars represent the sales of each product from Store B.
Note #1: This example assumes that the data is arranged the same way in each sheet.
Note #2: In this example, we created a chart using data from two sheets. However, you can add as many ranges for Series in the Chart editor panel as you’d like to create a chart using even more sheets.
Additional Resources
The following tutorials explain how to perform other common tasks in Google Sheets:
How to Add Average Line to Chart in Google Sheets
How to Add Trendline to Chart in Google Sheets
How to Plot Multiple Lines in Google Sheets