Named after Italian statistician Corrado Gini, the Gini coefficient is a way to measure the income distribution of a population.
The value for the Gini coefficient ranges from 0 to 1 where higher values represent greater income inequality and where:
- 0 represents perfect income equality (everyone has the same income)
- 1 represents perfect income inequality (one individual has all the income)
You can find a list of Gini coefficients by country here.
The following examples show two ways to calculate a Gini coefficient in R by using the Gini() function from the DescTools package.
Example 1: Calculate Gini Coefficient Using Individual Incomes
Suppose we have the following list of annual incomes for 10 individuals:
Income: $50k, $50k, $70k, $70k, $70k, $90k, $150k, $150k, $150k, $150k
The following code shows how to use the Gini() function to calculate the Gini coefficient for this population:
library(DescTools)

#define vector of incomes
x #calculate Gini coefficient
Gini(x, unbiased=FALSE)

[1] 0.226
The Gini coefficient turns out to be 0.226.
Note: In a real-world scenario there would be hundreds of thousands of different incomes for individuals in a certain country, but in this example we used 10 individuals as a simple illustration.
Example 2: Calculate Gini Coefficient Using Frequencies
Suppose we have the following frequency table that shows the number of individuals in a certain population with specific incomes:
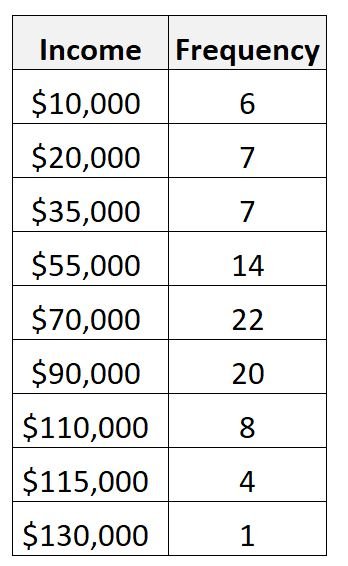
The following code shows how to use the Gini() function to calculate the Gini coefficient for this population:
library(DescTools)

#define vector of incomes
x #define vector of frequencies
n #calculate Gini coefficient
Gini(x, n, unbiased=FALSE)

[1] 0.2632289
The Gini coefficient turns out to be 0.26232.
Note: You can find the complete documentation for the Gini() function from the DescTools package here.
Additional Resources
The following tutorials explain how to calculate a Gini coefficient and how to create a Lorenz curve in Excel:
How to Calculate Gini Coefficient in Excel
How to Create a Lorenz Curve in Excel