By default, the title of plots in ggplot2 are left-aligned.
However, you can use the following methods to change the title position:
Method 1: Center the Title
some_ggplot +
  theme(plot.title = element_text(hjust = 0.5))
Method 2: Right-Align the Title
some_ggplot +
  theme(plot.title = element_text(hjust = 1))
Method 3: Adjust Title Position Vertically
some_ggplot +
  theme(plot.title = element_text(vjust = 10))
The following examples show how to use each method in practice with the built-in mtcars dataset in R.
Example 1: Center the Title
The following code shows how to create a scatterplot in ggplot2 and center the title using the hjust argument:
library(ggplot2)

#create scatterplot with centered title
ggplot(data=mtcars, aes(x=mpg, y=wt)) +
  geom_point() +
  ggtitle("Plot Title") +
  theme(plot.title = element_text(hjust = 0.5))
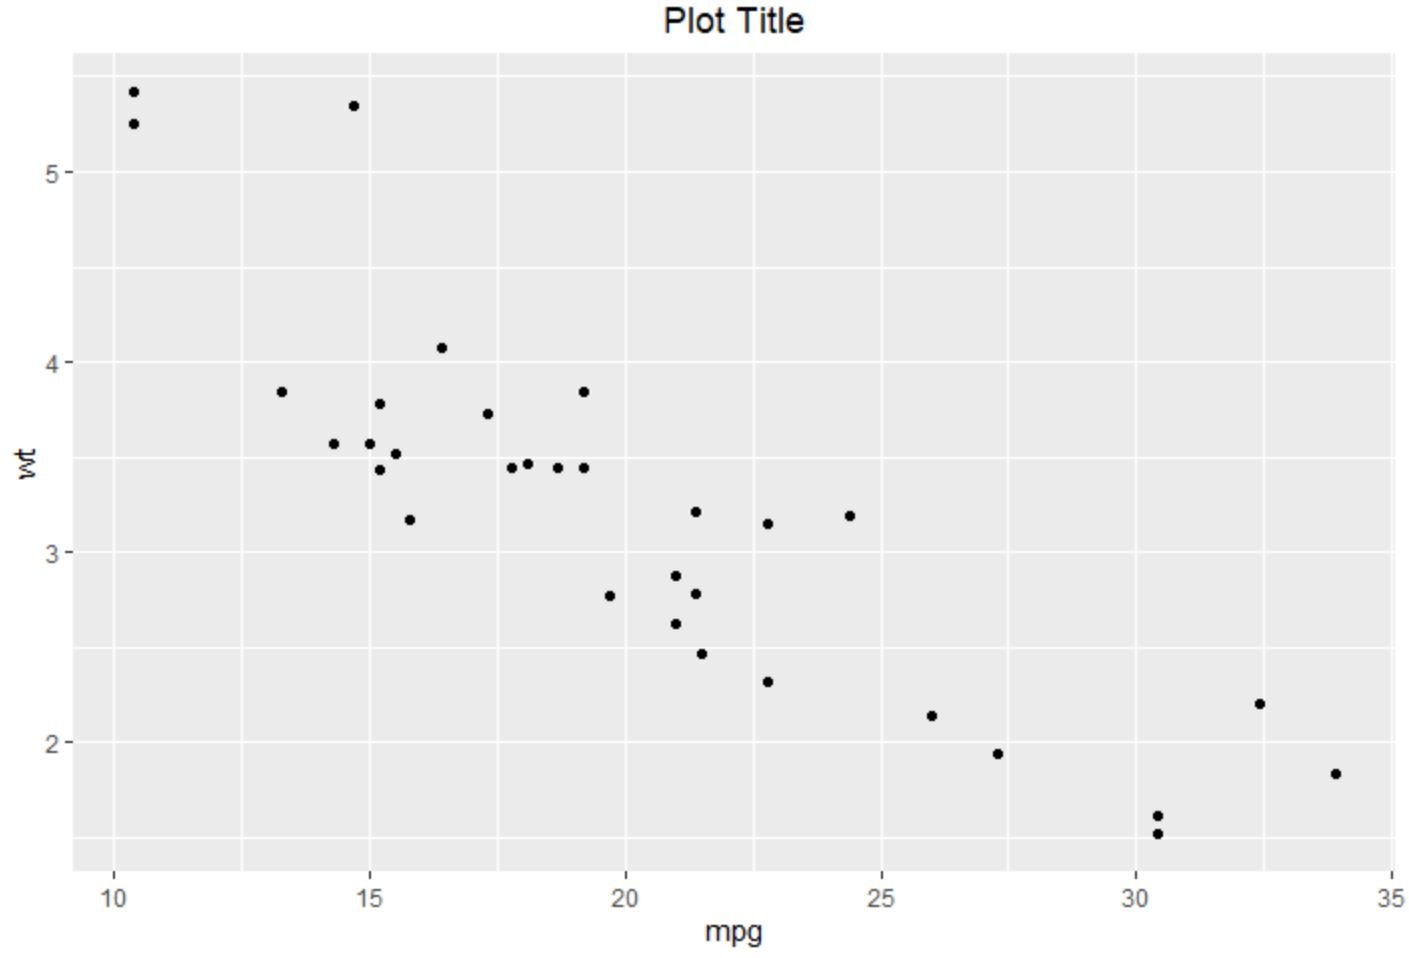
Notice that the title is aligned in the center.
Example 2: Right-Align the Title
The following code shows how to create a scatterplot in ggplot2 and right-align the title using the hjust argument:
library(ggplot2)

#create scatterplot with right-aligned title
ggplot(data=mtcars, aes(x=mpg, y=wt)) +
  geom_point() +
  ggtitle("Plot Title") +
  theme(plot.title = element_text(hjust = 1))
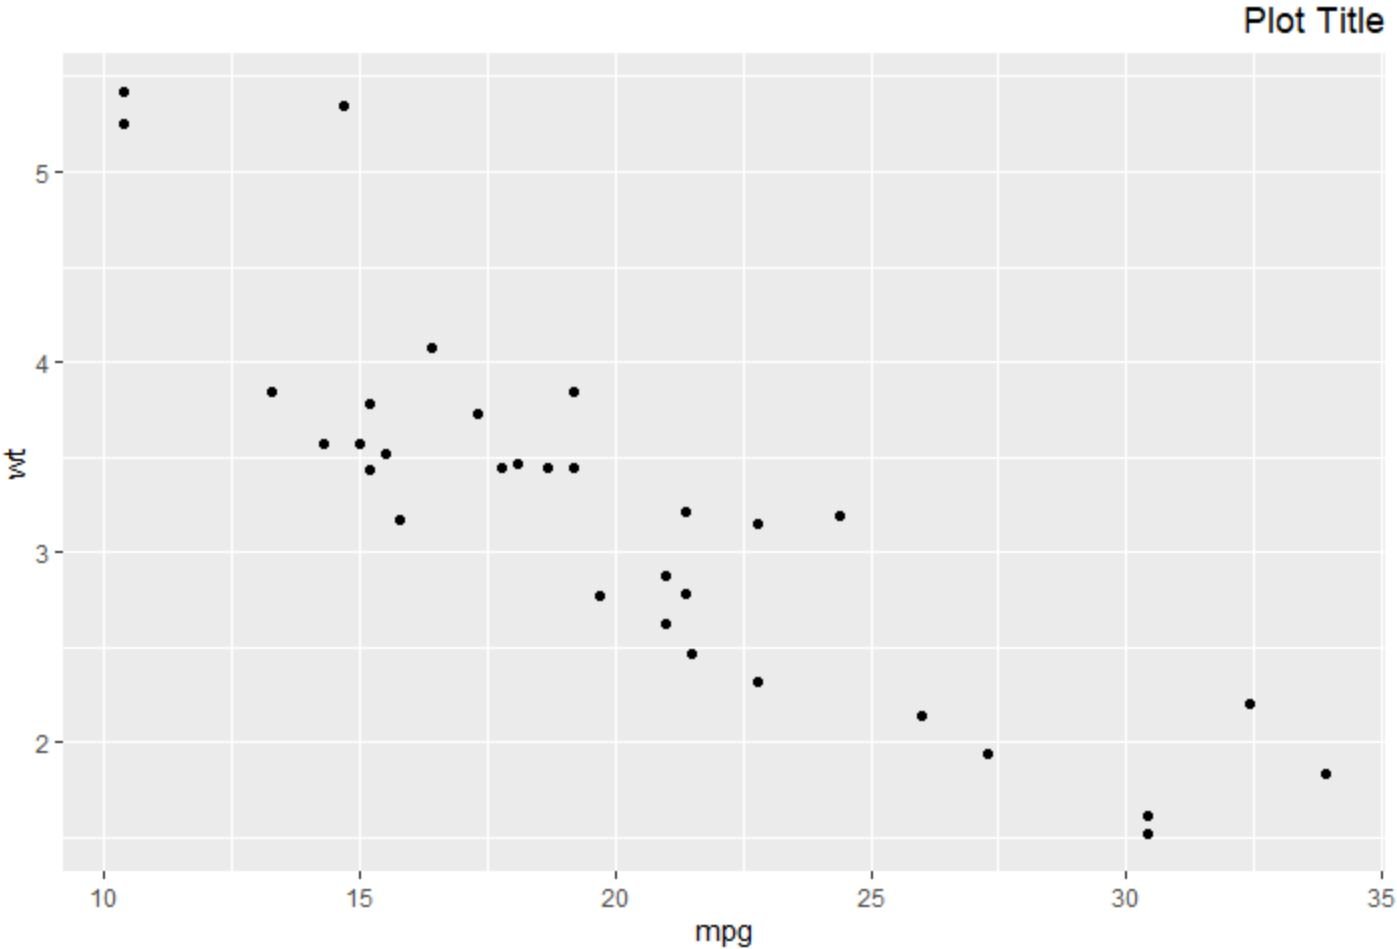
Notice that the title is aligned to the right.
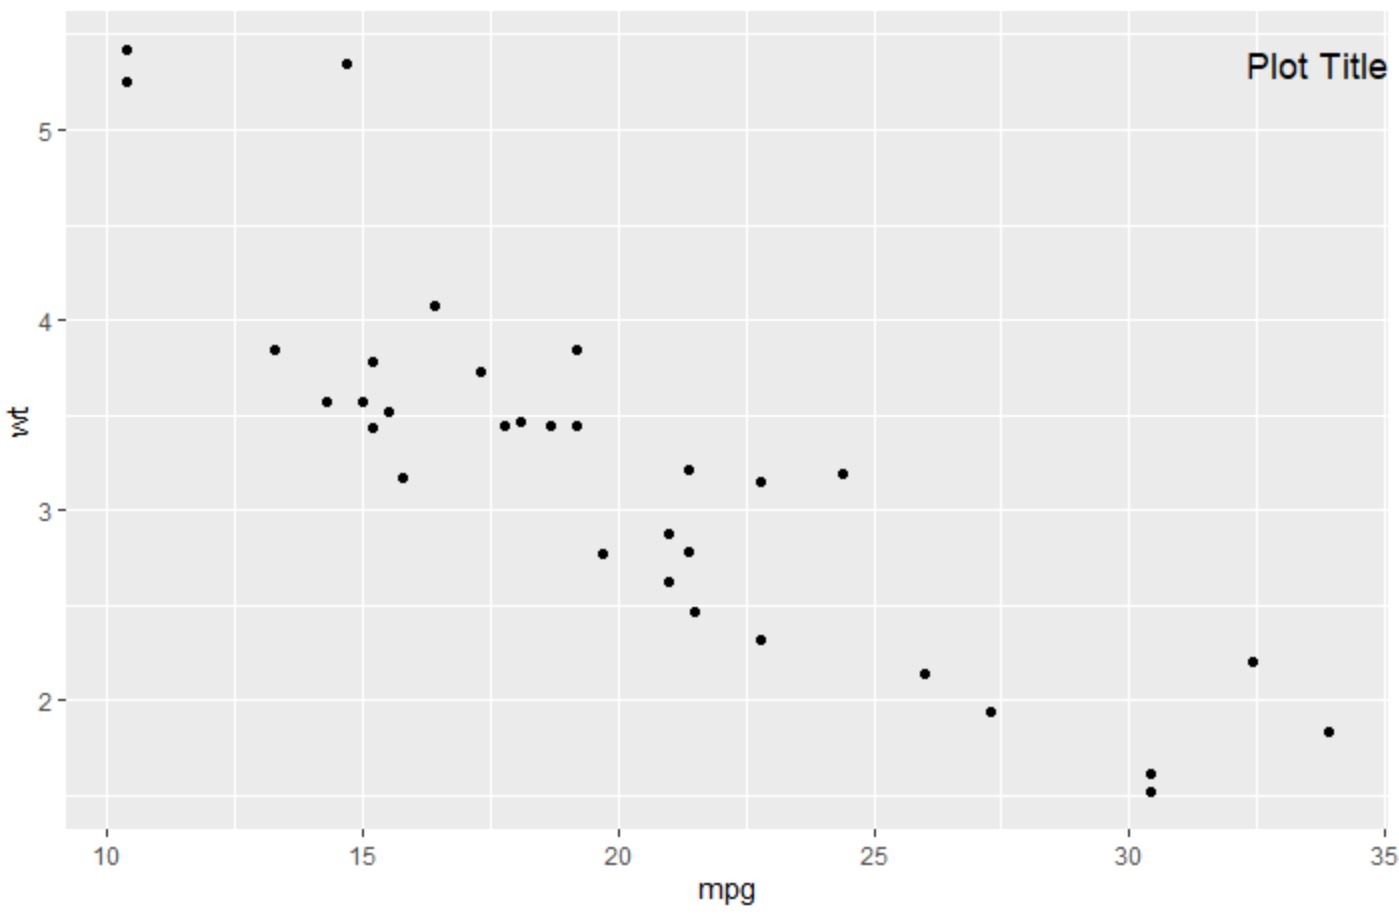
Example 3: Adjust Title Position Vertically
The following code shows how to create a scatterplot in ggplot2 and move the title higher up using the vjust argument:
library(ggplot2)

#create scatterplot with title moved higher up
ggplot(data=mtcars, aes(x=mpg, y=wt)) +
  geom_point() +
  ggtitle("Plot Title") +
  theme(plot.title = element_text(hjust = 1, vjust = 3))

Notice that the title is moved higher up.
You can also provide a negative value to the vjust argument to move the title lower down:
library(ggplot2)

#create scatterplot with title moved down
ggplot(data=mtcars, aes(x=mpg, y=wt)) +
  geom_point() +
  ggtitle("Plot Title") +
  theme(plot.title = element_text(hjust = 1, vjust = -10))
Notice that the title is now moved inside the plot.
Additional Resources
The following tutorials explain how to perform other common operations in ggplot2:
How to Change the Legend Title in ggplot2
How to Rotate Axis Labels in ggplot2
How to Fix in R: could not find function “ggplot”