You can use the following basic syntax to order the y-axis labels alphabetically in ggplot2:
#sort y-axis variable in alphabetical order
df$y_var#create scatter plot with y-axis in alphabetical order
ggplot(df, aes(x=x_var, y=y_var)) +
  geom_point()
The following example shows how to use this syntax in practice.
Example: Order Y-Axis Labels Alphabetically in ggplot2
Suppose we have the following data frame in R that shows the points scored by various basketball teams:
#create data frame
df frame(team=c('B', 'D', 'E', 'F', 'A', 'C', 'H', 'G'),
                 points=c(22, 12, 10, 30, 12, 17, 28, 23))

#view data frame
df

  team points
1    B     22
2    D     12
3    E     10
4    F     30
5    A     12
6    C     17
7    H     28
8    G     23
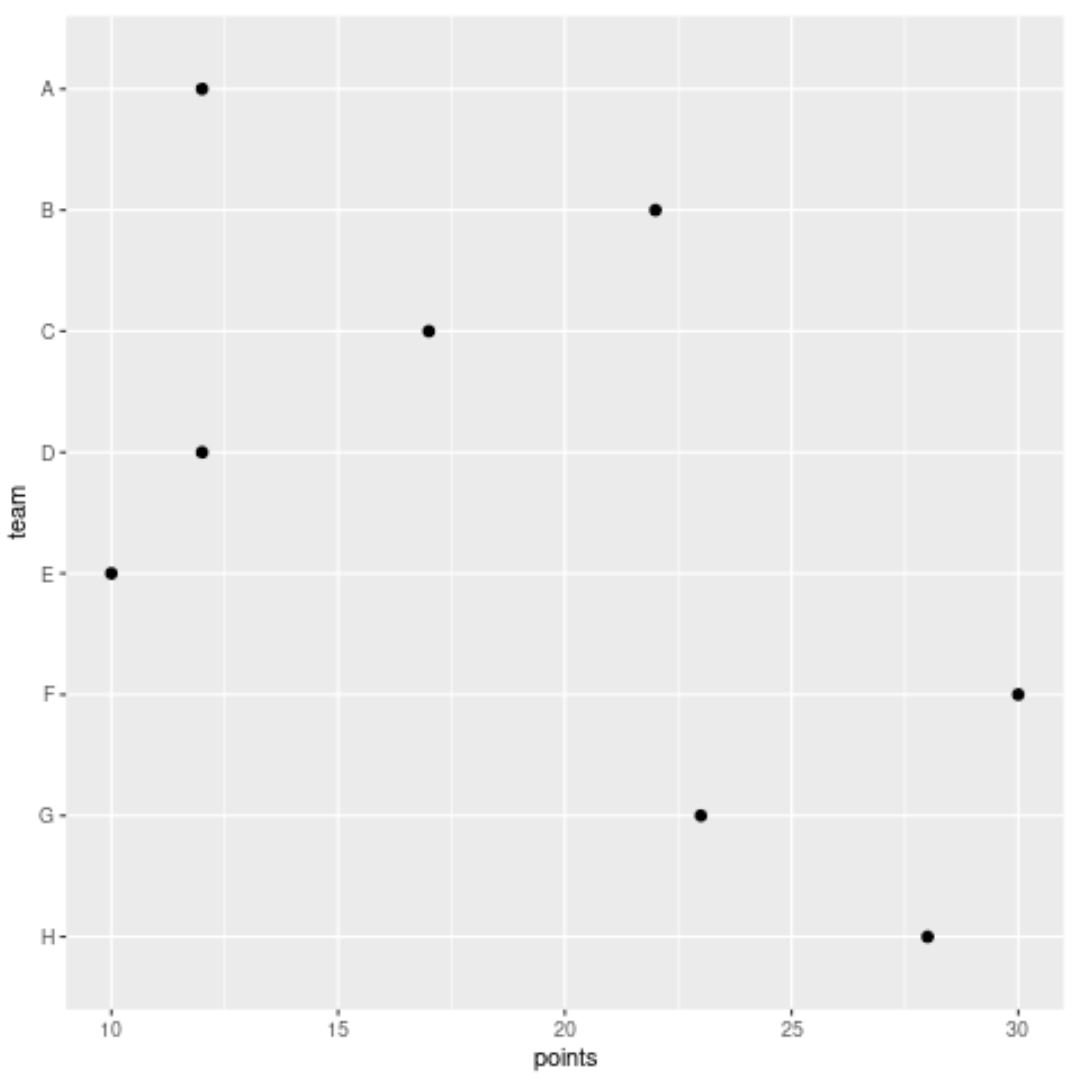
If we create a scatter plot with points on the x-axis and team on the y-axis, ggplot2 will automatically display the teams in alphabetical order (starting from the bottom):
library(ggplot2)

#create scatter plot
ggplot(df, aes(x=points, y=team)) +
  geom_point(size=2)

Notice that the labels on the y-axis are in alphabetical order from A to Z, starting from the bottom.
To arrange the y-axis labels in reverse alphabetical order, we can use the following code:
library(ggplot2)

#sort y-axis variable in alphabetical order
df$team#create scatter plot with y-axis in alphabetical order
ggplot(df, aes(x=points, y=team)) +
  geom_point()
Notice that the labels on the y-axis are now in reverse alphabetical order, starting from the bottom.
Additional Resources
The following tutorials explain how to perform other common tasks in ggplot2:
How to Rotate Axis Labels in ggplot2
How to Set Axis Breaks in ggplot2
How to Set Axis Limits in ggplot2
How to Change Legend Labels in ggplot2