You can use geom_smooth() to add confidence interval lines to a plot in ggplot2:
library(ggplot2)

some_ggplot +
  geom_point() +
  geom_smooth(method=lm)
The following examples show how to use this syntax in practice with the built-in mtcars dataset in R.
Example 1: Add Confidence Interval Lines in ggplot2
The following code shows how to create a scatterplot in ggplot2 and add a line of best fit along with 95% confidence bands:
library(ggplot2)

#create scatterplot with confidence bands
ggplot(data=mtcars, aes(x=mpg, y=wt)) +
  geom_point() +
  geom_smooth(method=lm)
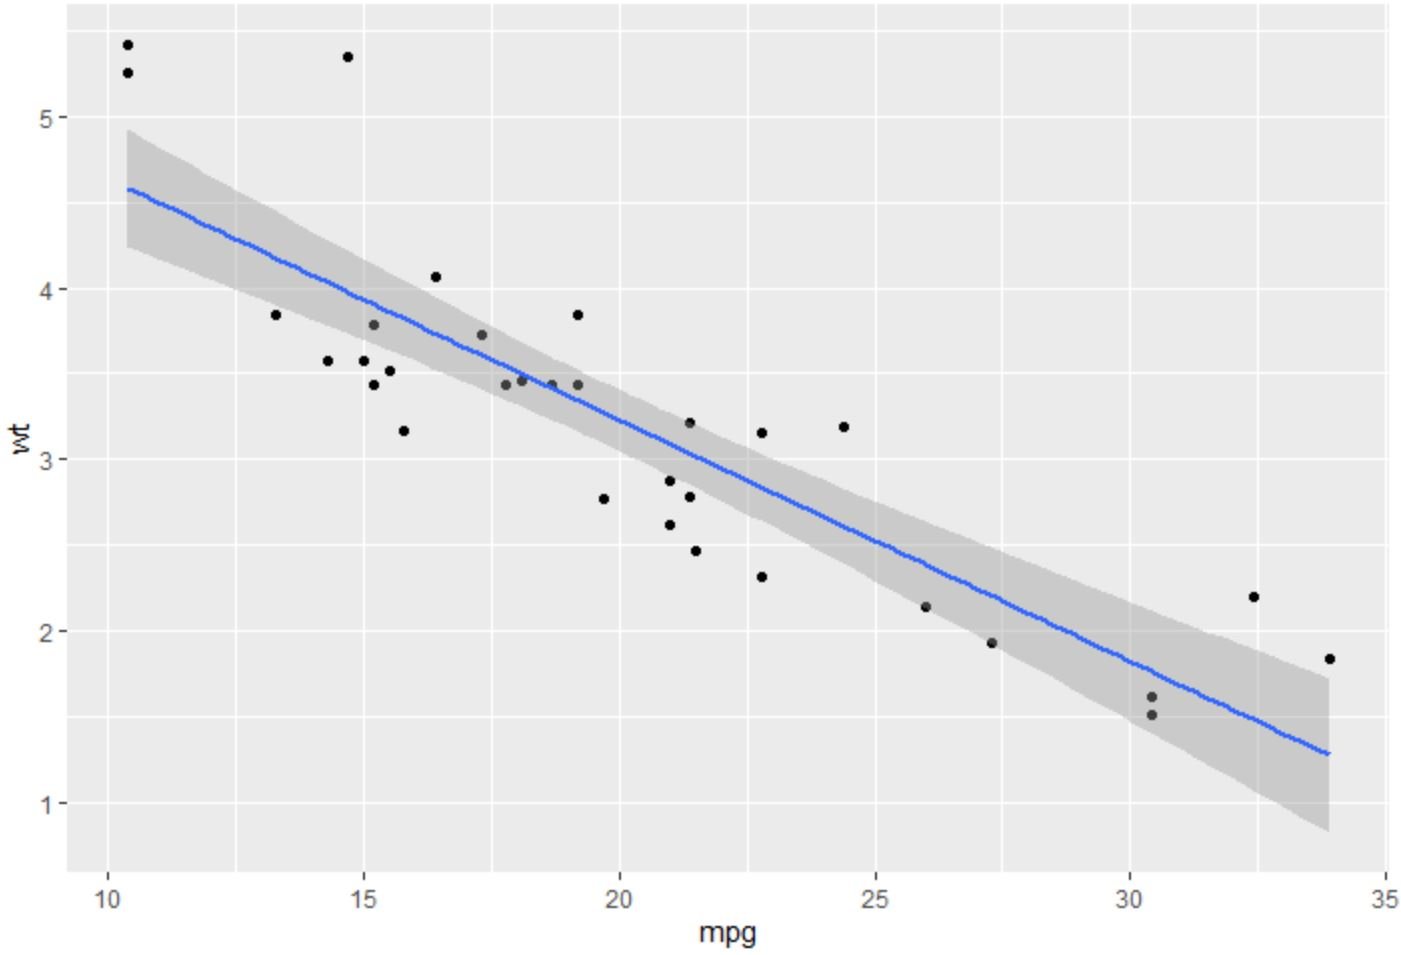
The blue line represents the fitted linear regression line and the grey bands represent the 95% confidence interval bands.
Example 2: Modify Level of Confidence Interval
By default, geom_smooth() uses 95% confidence bands but you can use the level argument to specify a different confidence level.
For example, we may choose to create 90% confidence bands instead:
library(ggplot2)

#create scatterplot with 90% confidence bands
ggplot(data=mtcars, aes(x=mpg, y=wt)) +
  geom_point() +
  geom_smooth(method=lm, level=0.90)

The smaller the confidence level you use, the more narrow the confidence interval bands will be around the regression line.
Example 3: Modify Appearance of Confidence Interval Lines
You can also use the color and fill arguments to modify the color of the regression line and the color of the confidence interval bands, respectively:
library(ggplot2)

#create scatterplot with custom confidence interval lines
ggplot(data=mtcars, aes(x=mpg, y=wt)) +
  geom_point() +
  geom_smooth(method=lm, color='red', fill='lightblue')
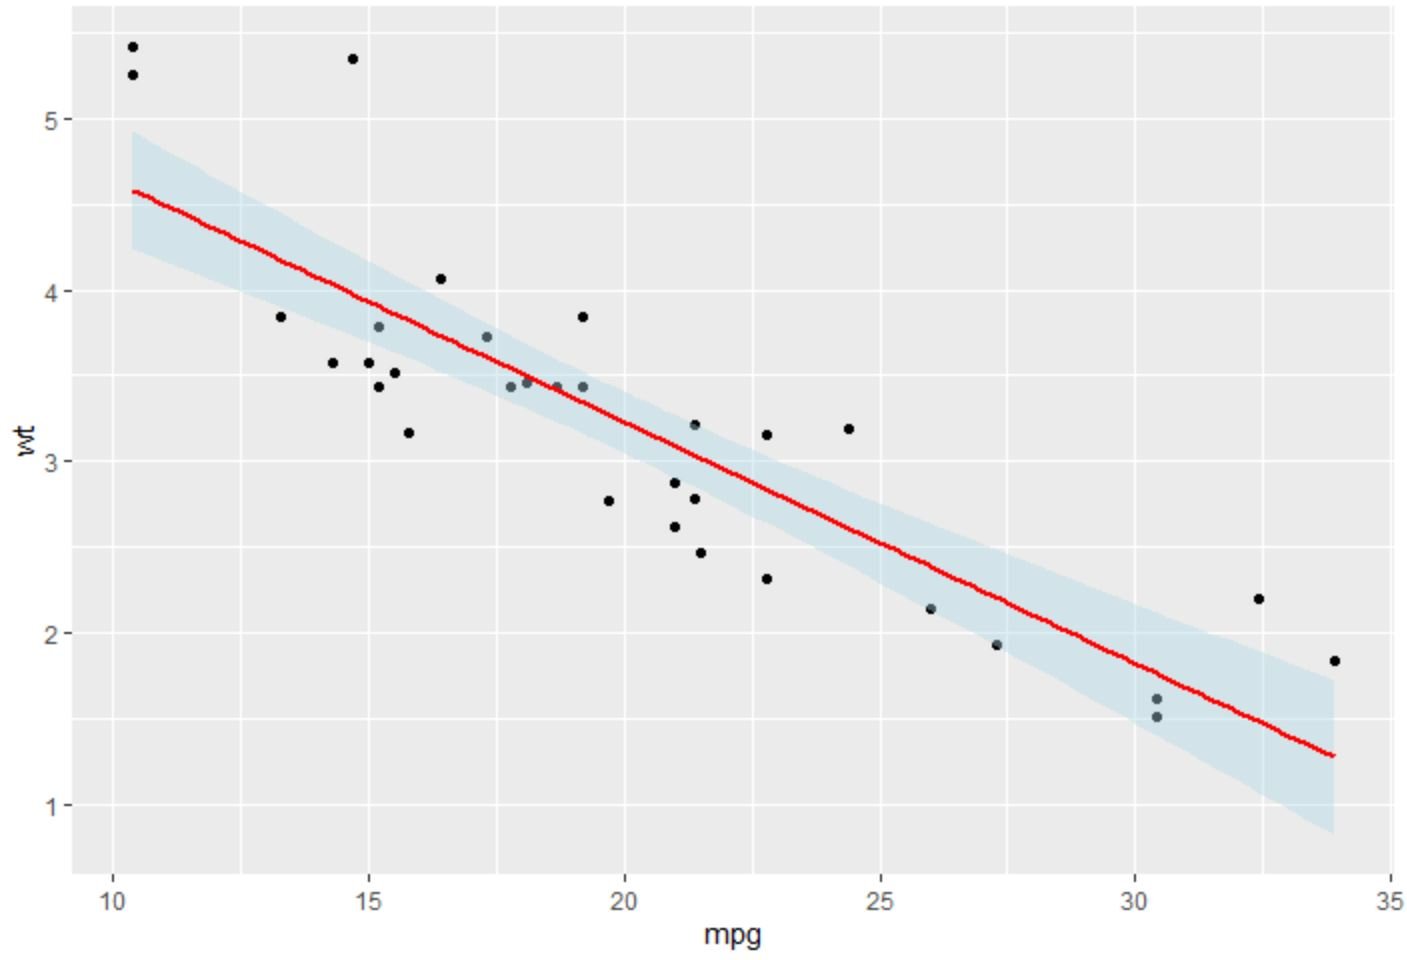
The regression line is now red and the confidence interval bands are filled in with light blue.
Note: You can find the complete documentation for the geom_smooth() function here.
Additional Resources
The following tutorials explain how to perform other common operations in ggplot2:
How to Change the Legend Title in ggplot2
How to Rotate Axis Labels in ggplot2
How to Fix in R: could not find function “ggplot”