You can use the FORECAST function in Google Sheets to calculate the expected value of some future observation using historical data.
This function uses the following methods:
Method 1: Forecast One Future Value
=FORECAST(A17, B2:B16, A2:A16)
This particular formula forecasts the y-value that corresponds to the x-value in cell A17 using the range B2:B16 as the past y-values and the range A2:A16 as the past x-values.
Method 2: Forecast Multiple Future Values
=ArrayFormula(FORECAST(A17:A19, B2:B16, A2:A16))
This particular formula forecasts the y-values that corresponds to the x-values in the range A17:A19 using the range B2:B16 as the past y-values and the range A2:A16 as the past x-values.
The following examples show how to use each method in practice.
Example 1: Forecast One Future Value
The following screenshot shows how to use the FORECAST function to forecast the sales value for 4/1/2021 using A2:A16 as the historical months and B2:B16 as the historical sales values:
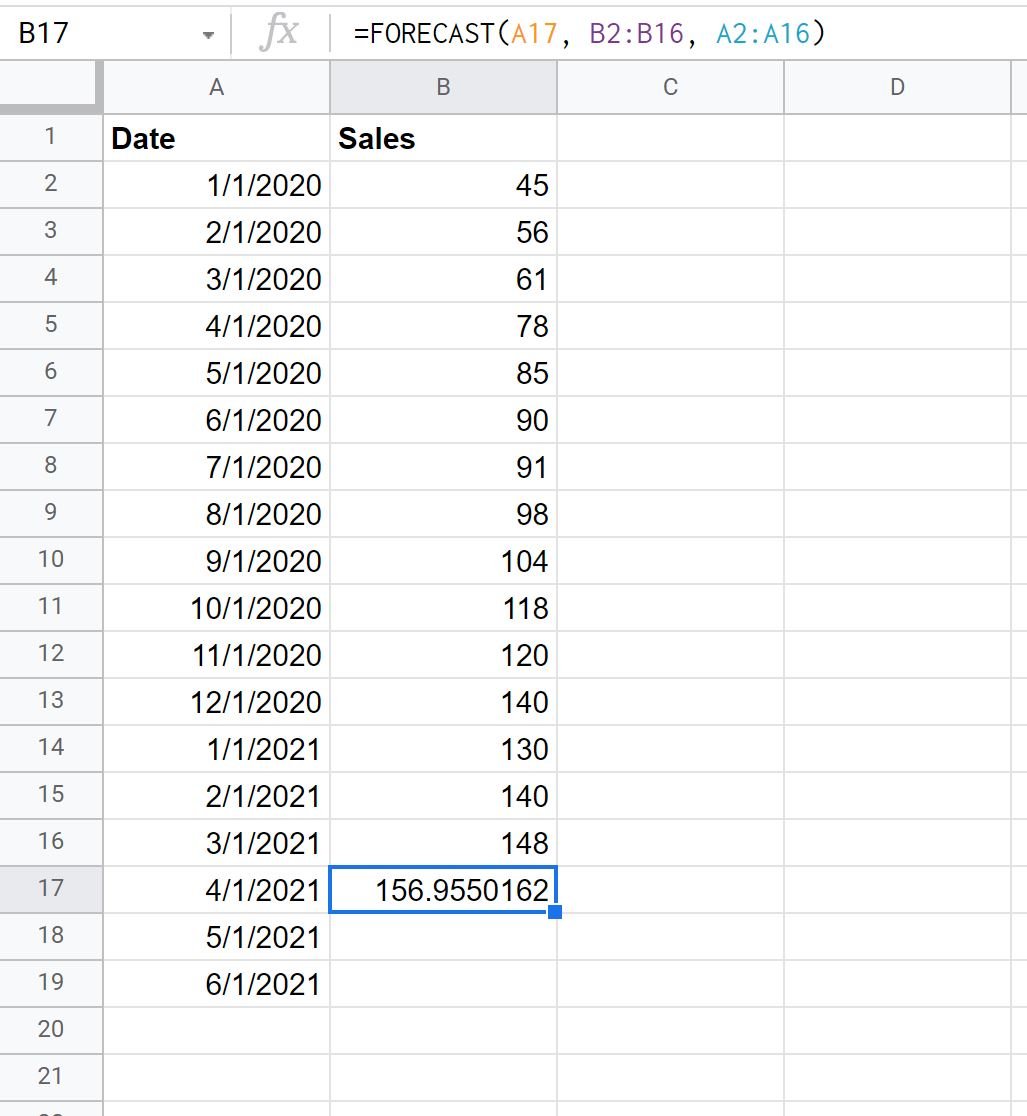
The FORECAST function predicts that there will be 156.955 total sales on 4/1/2021.
Example 2: Forecast Multiple Future Values
The following screenshot shows how to use the FORECAST function to forecast the sales values for 4/1/2021 through 6/1/2021 using A2:A16 as the historical months and B2:B16 as the historical sales values:
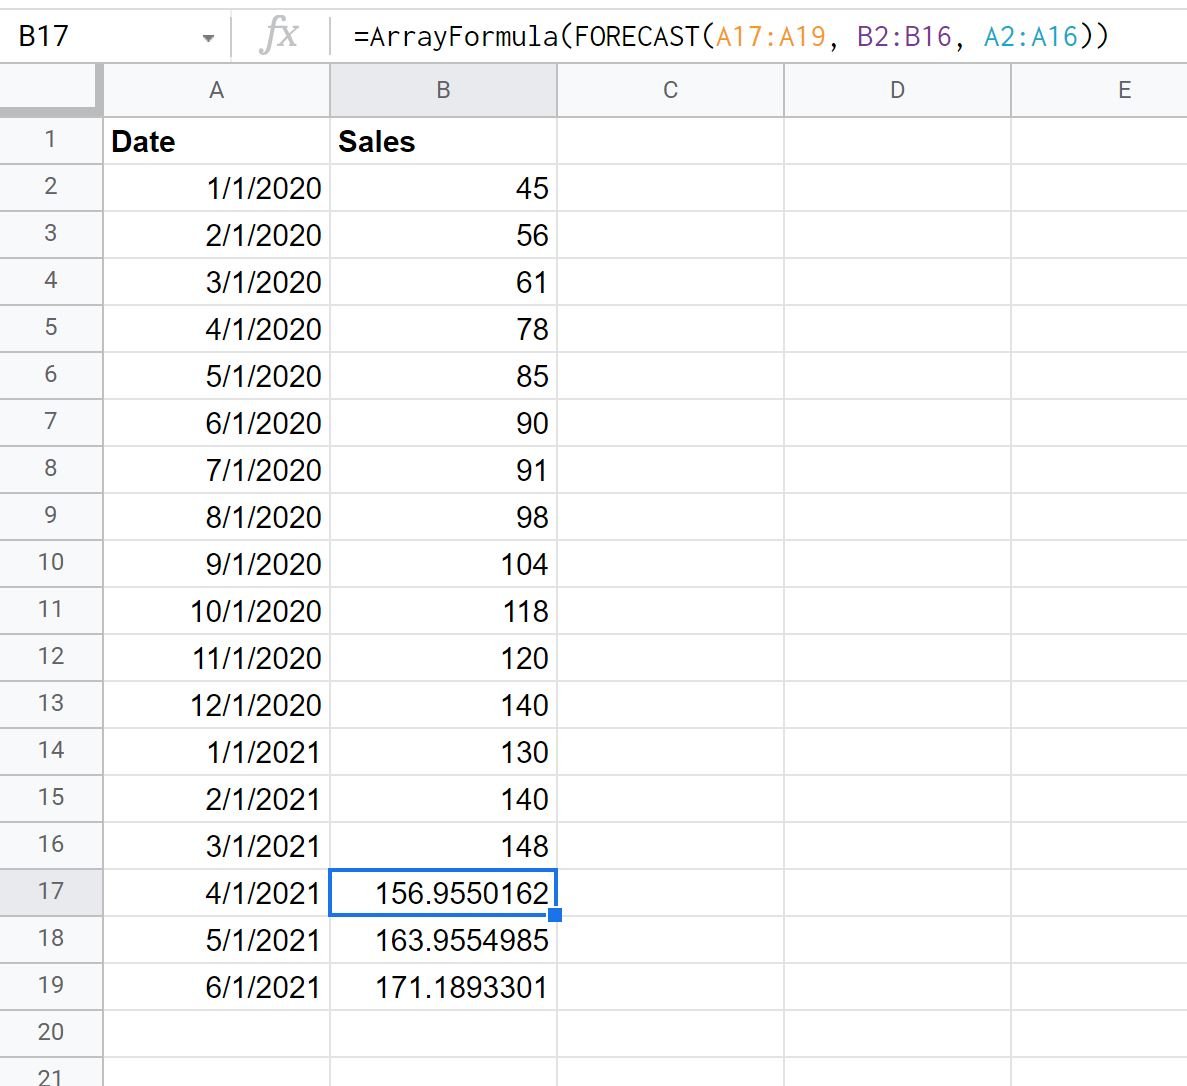
We can see that the FORECAST function produces a forecasted number of sales for each of the three months that we specified.
Note that you can also create a bar chart to visualize the predicted sales. Simply highlight the cells in the range A2:B19, then click the Insert tab, then click Chart. A bar chart will automatically be created.
Click on the last three bars in the chart to change each of their fill colors to red to indicate that they represent predicted values:
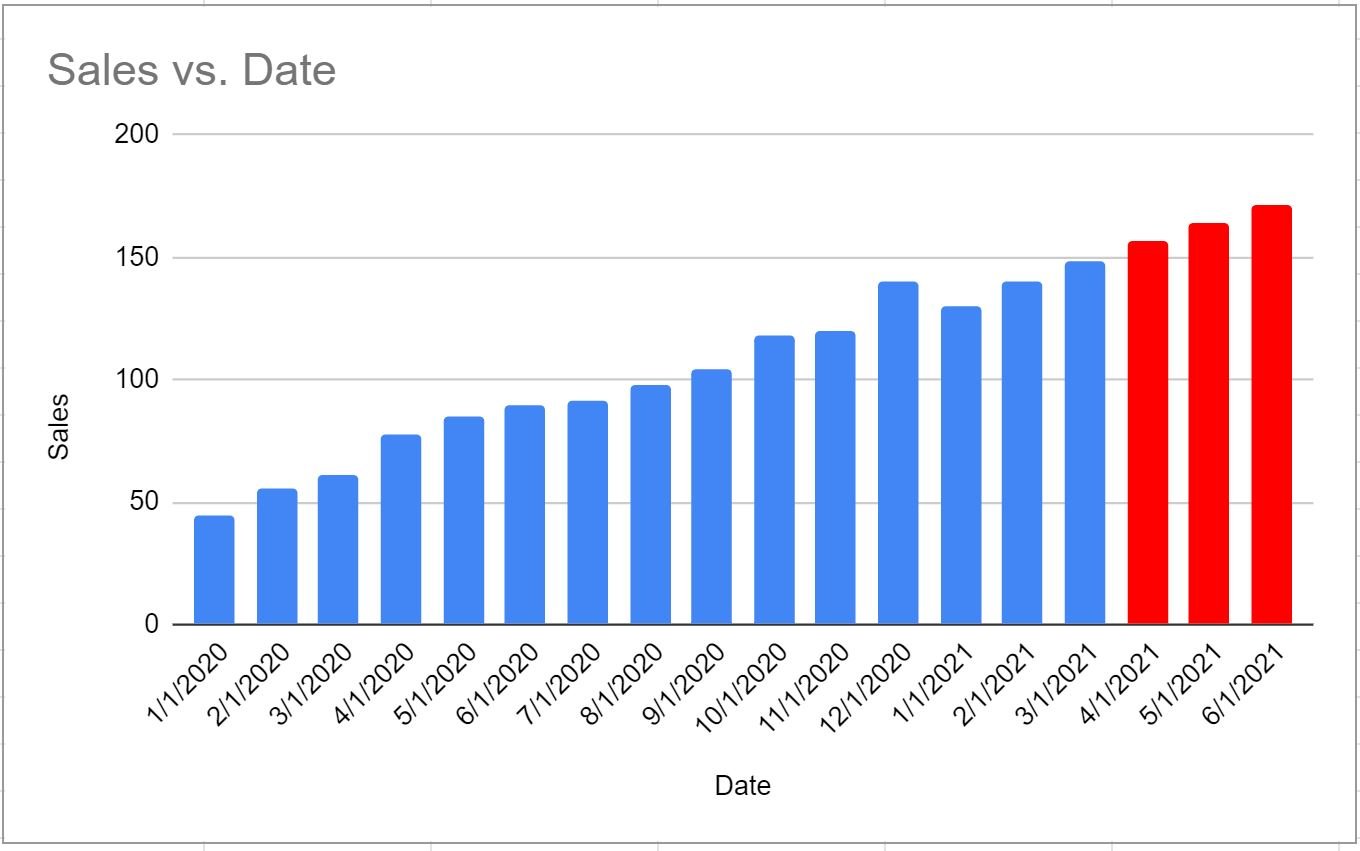
The x-axis shows the date and the y-axis shows the sales for each date.
Note 1: Under the hood, the FORECAST function simply uses simple linear regression to find the line that best fits the dataset and then uses the fitted regression model to predict future values.
Note 2: You can find the complete documentation for the FORECAST function in Google Sheets here.
Additional Resources
The following tutorials explain how to perform other common tasks in Google Sheets:
How to Perform Linear Regression in Google Sheets
Polynomial Regression in Google Sheets
How to Find A Line of Best Fit in Google Sheets