Fisher’s Exact Test is used to determine whether or not there is a significant association between two categorical variables.
It is typically used as an alternative to the Chi-Square Test of Independence when one or more of the cell counts in a 2×2 table is less than 5.
Fisher’s Exact Test uses the following null and alternative hypotheses:
- H0: (null hypothesis) The two variables are independent.
- H1: (alternative hypothesis) The two variables are not independent.
If the p-value of the test is less than a certain significance level, we can reject the null hypothesis of the test and conclude that the two variables are not independent, i.e. they have a significant association.
The following example shows how to perform Fisher’s Exact Test in SAS.
Example: Fisher’s Exact Test in SAS
Suppose we want to know whether or not gender is associated with political party preference at a particular college.
To explore this, we randomly select 25 students on campus and ask them about their political party preference. The results are shown in the table below:
| Democrat | Republican | |
|---|---|---|
| Female | 8 | 4 |
| Male | 4 | 9 |
To determine if there is a statistically significant association between gender and political party preference, we can use the following steps to perform Fisher’s Exact Test in SAS:
Step 1: Create the Data
First, let’s create a dataset called my_data:
/*create data to hold survey results*/
data my_data;
    input Party $ Gender $;
    datalines;
Rep Female
Rep Female
Rep Female
Rep Female
Rep Male
Rep Male
Rep Male
Rep Male
Rep Male
Rep Male
Rep Male
Rep Male
Rep Male
Dem Female
Dem Female
Dem Female
Dem Female
Dem Female
Dem Female
Dem Female
Dem Female
Dem Male
Dem Male
Dem Male
Dem Male
;
run;
Step 2: Perform Fisher’s Exact Test
Next, we can use the following code to perform Fisher’s Exact Test:
/*perform Fisher's Exact test*/
proc freq;
    tables Party*Gender / fisher;
run;
The results of the test are shown below:
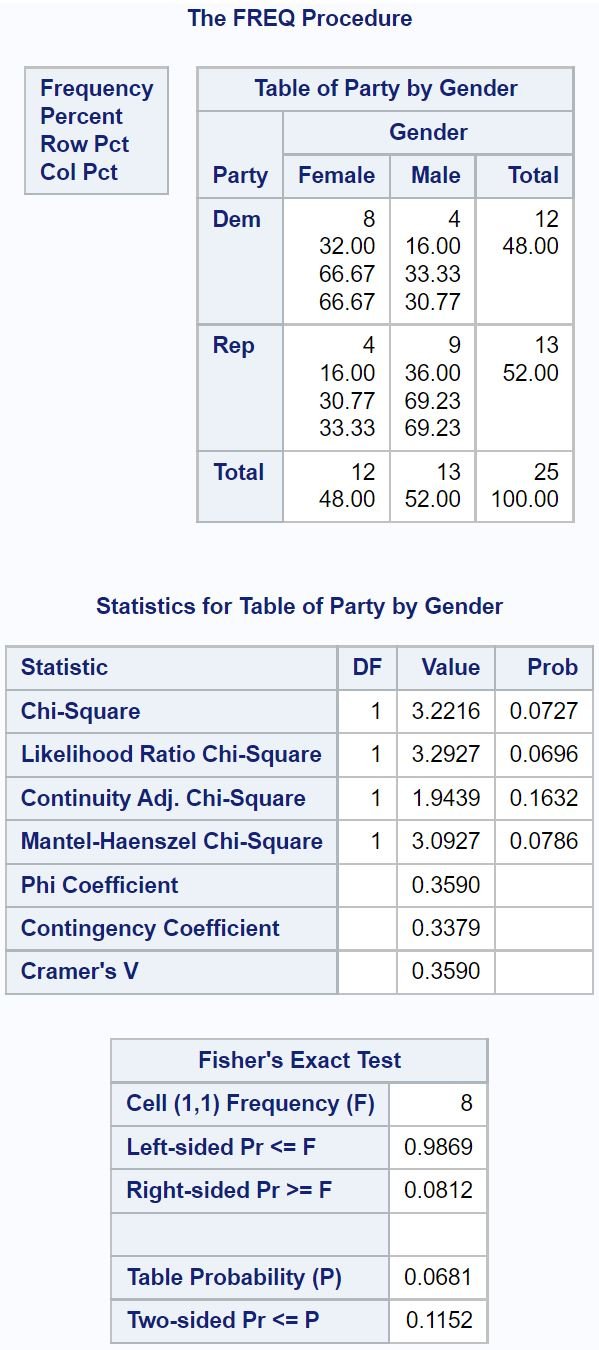
The null hypothesis for Fisher’s Exact Test is that the two variables are independent. In this example, our null hypothesis is that gender and political party preference are independent, which is a two-sided test.
Thus, we’ll look at the two-sided p-value in the final table of the output, which turns out to be 0.1152.
Since this p-value is not less than 0.05, we do not reject the null hypothesis.
This means we do not have sufficient evidence to say that there is a significant association between gender and political party preference.
Additional Resources
The following tutorials provide additional information about Fisher’s Exact Test:
Introduction to Fisher’s Exact Test
Fisher’s Exact Test Calculator
How to Report Fisher’s Exact Test Results