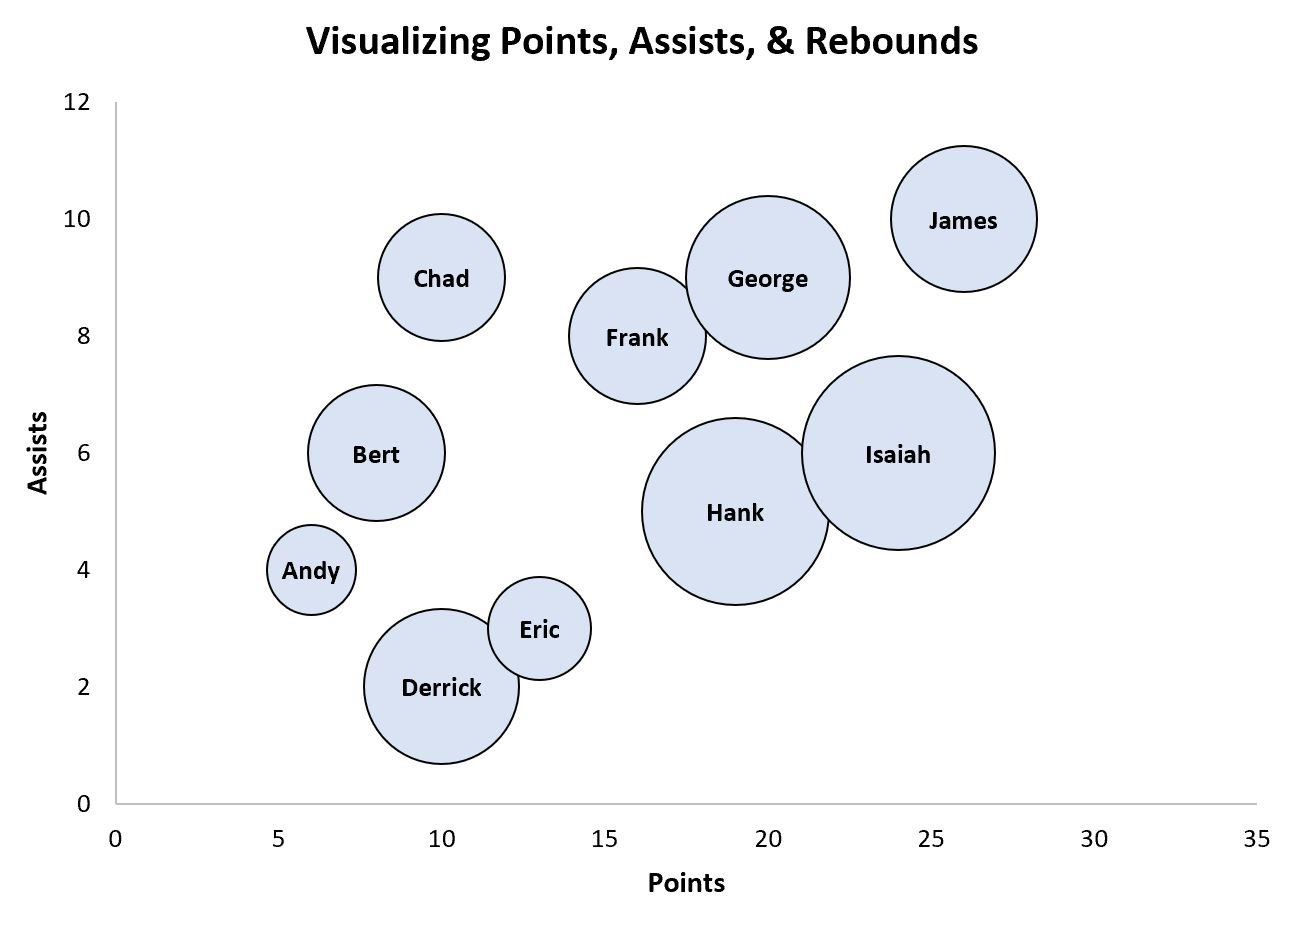
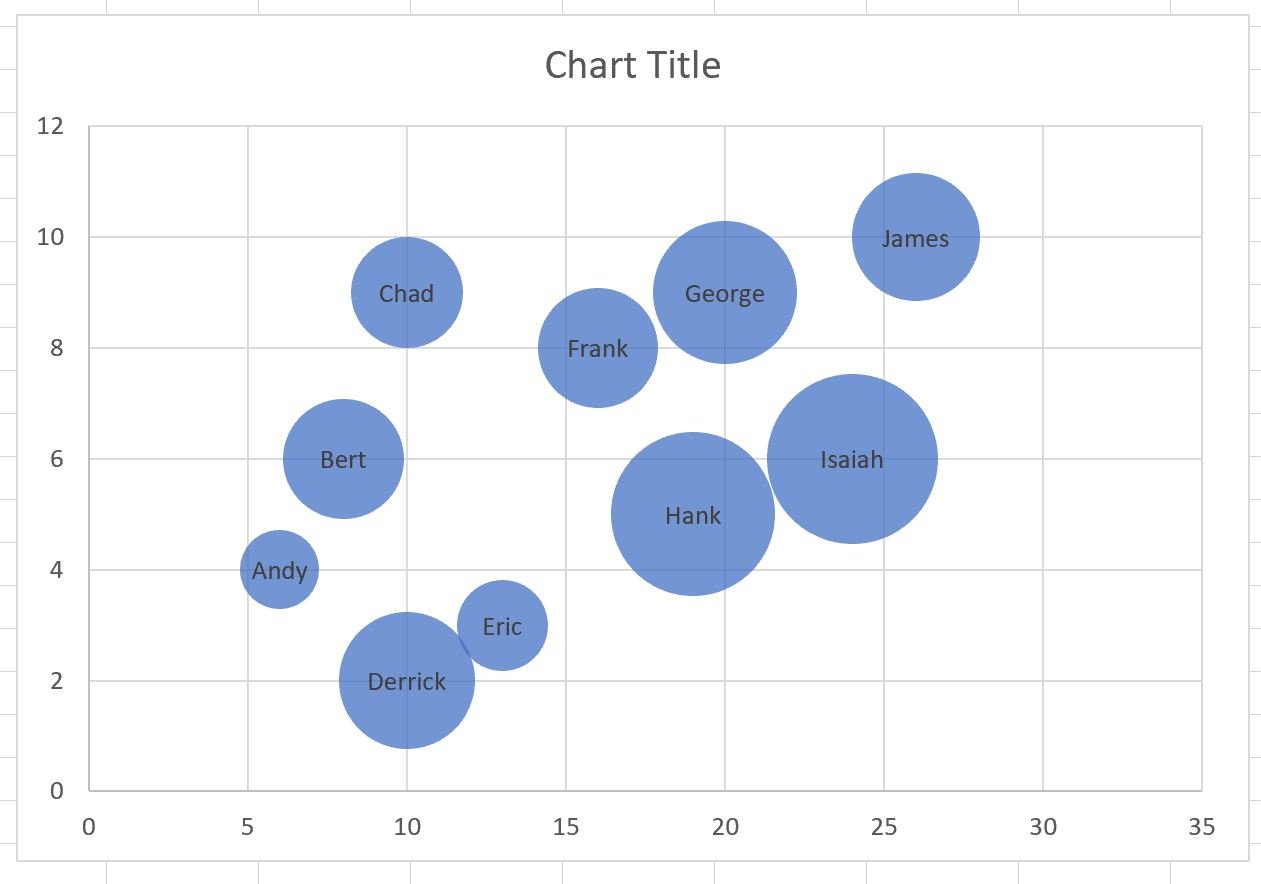
This tutorial provides a step-by-step example of how to create the following bubble chart with labels in Excel:
Step 1: Enter the Data
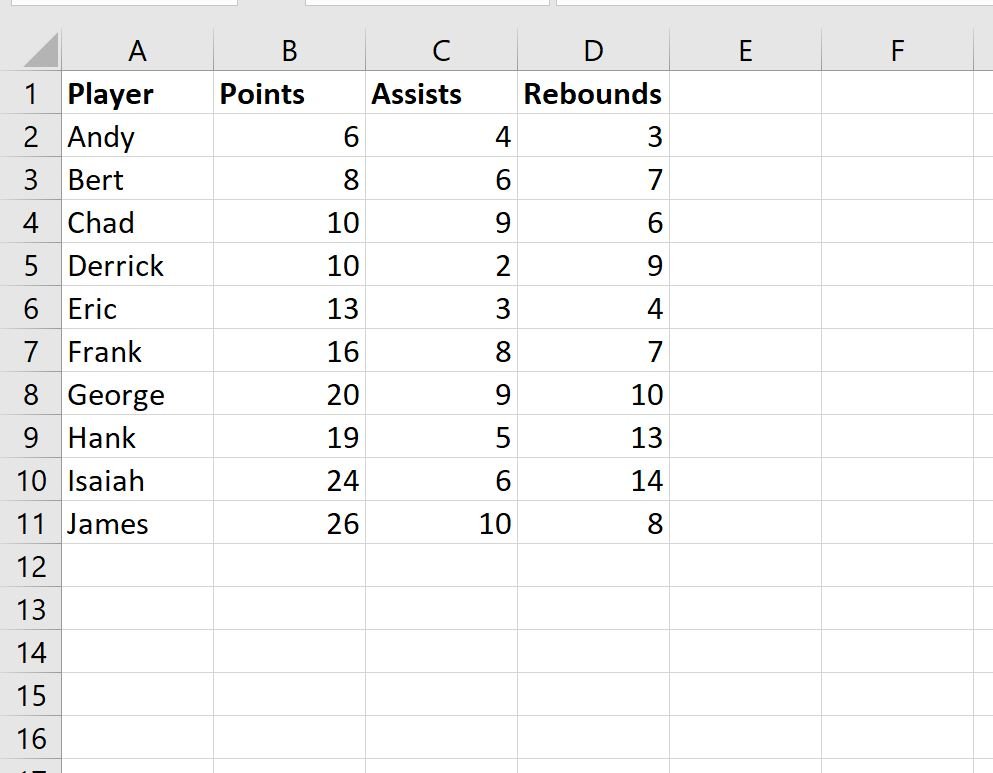
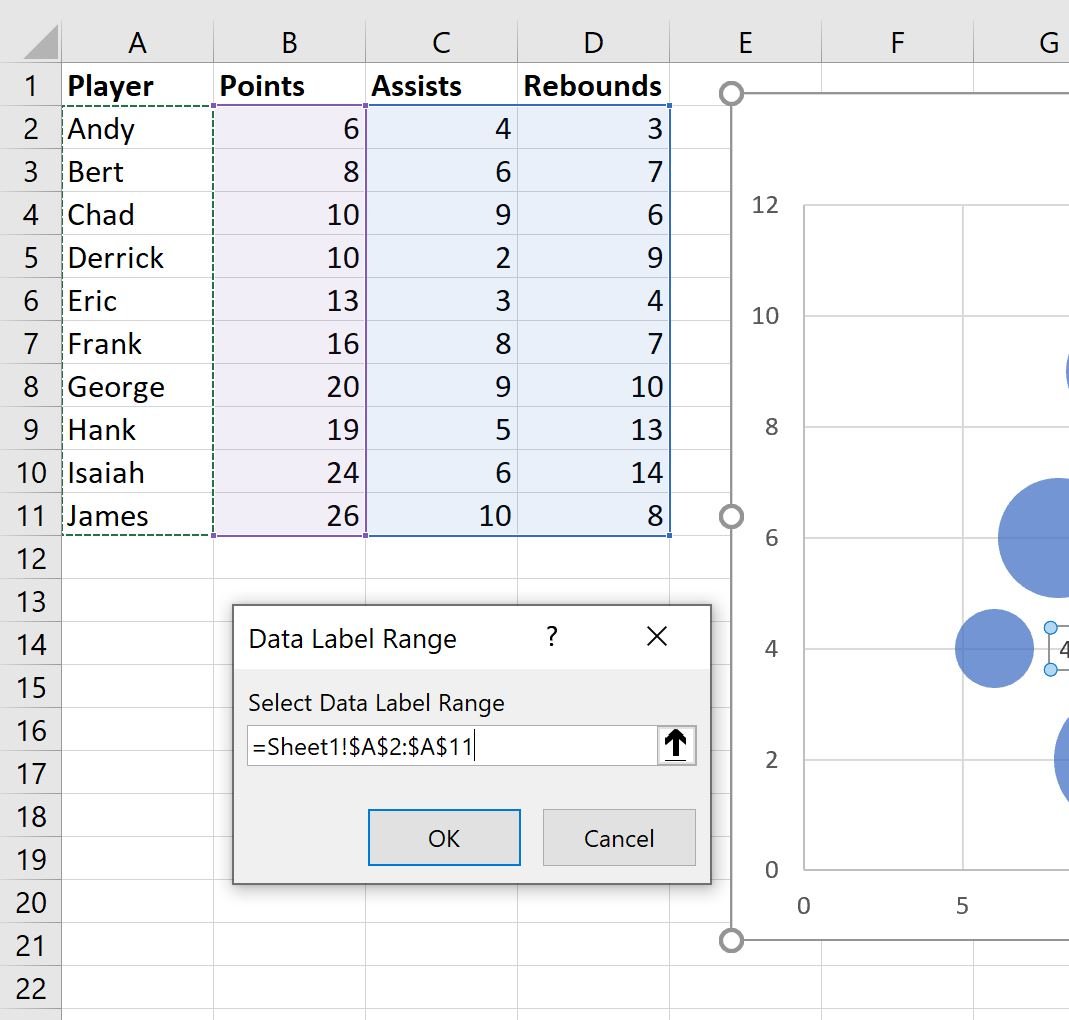
First, let’s enter the following data into Excel that shows various attributes for 10 different basketball players:
Step 2: Create the Bubble Chart
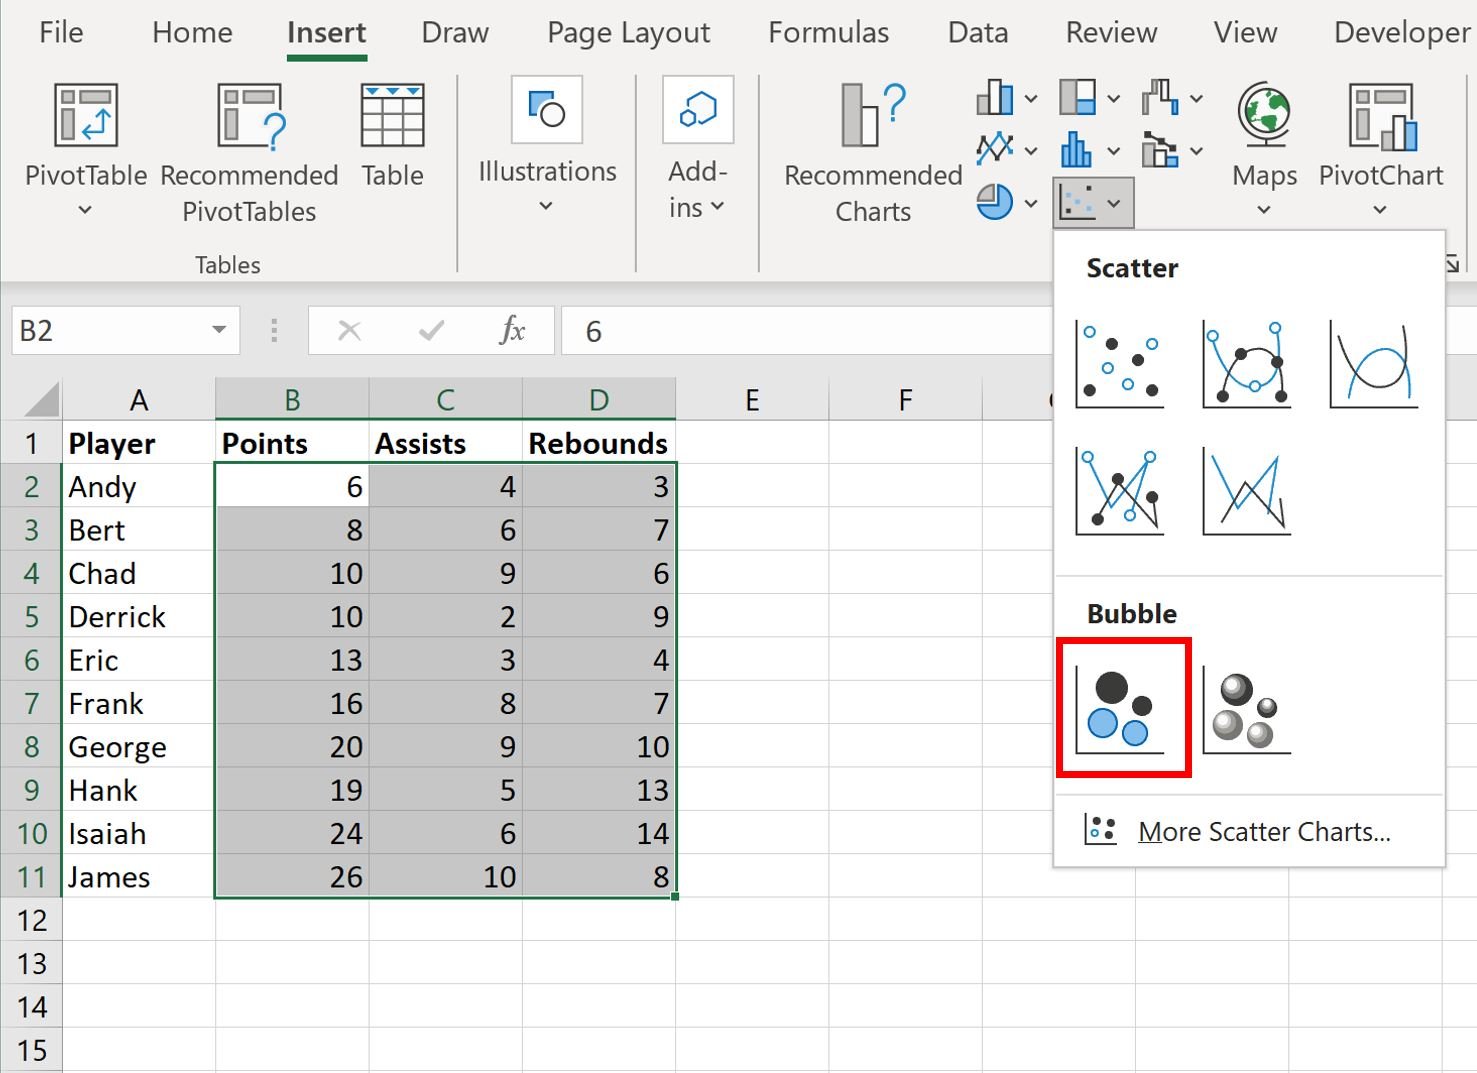
Next, highlight the cells in the range B2:D11. Then click the Insert tab along the top ribbon and then click the Bubble Chart option within the Charts group:
The following bubble chart will automatically be created:
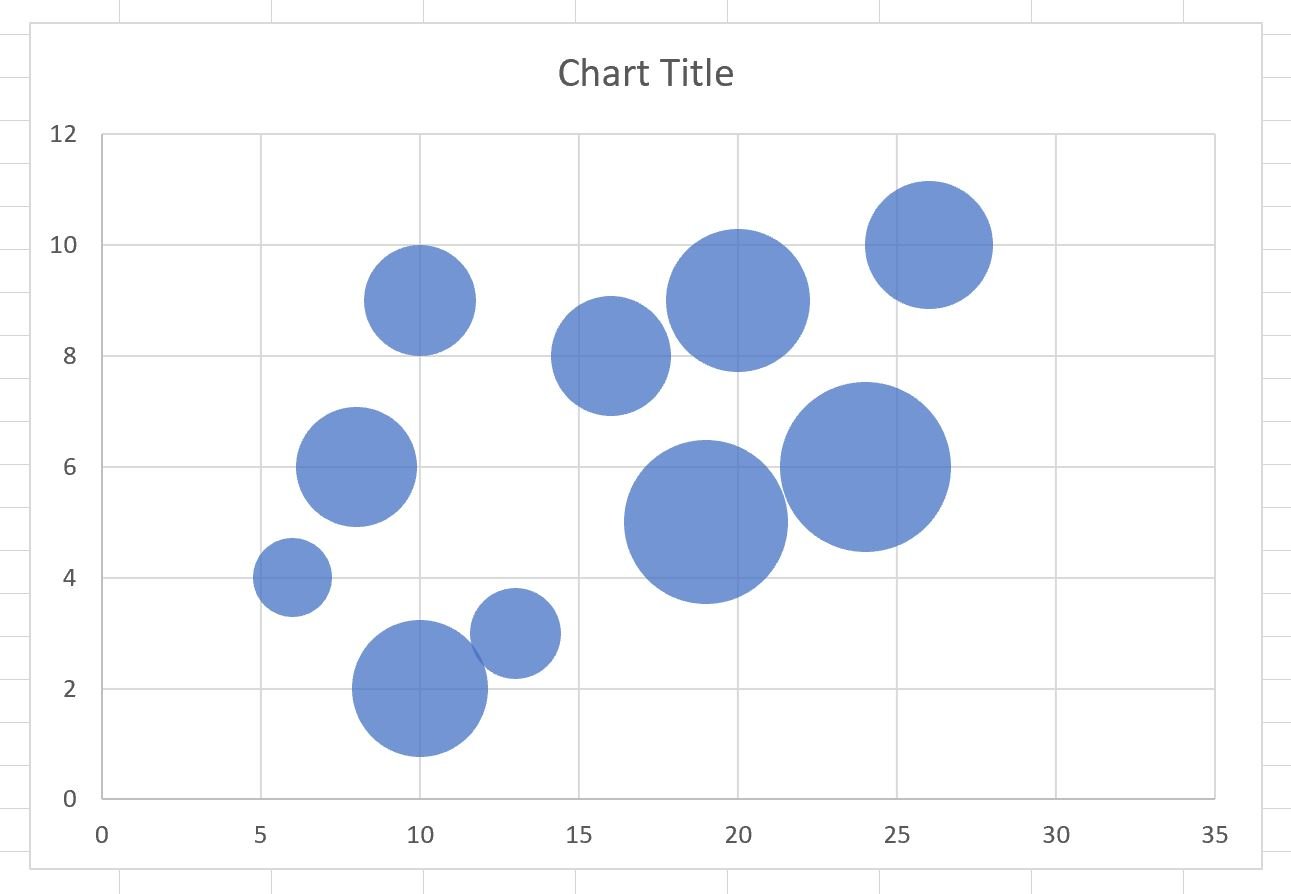
The x-axis displays the points, the y-axis displays the assists, and the size of each bubble represents the rebounds.
However, it’s tough to know which bubbles represent which players because there are no labels.
Step 3: Add Labels
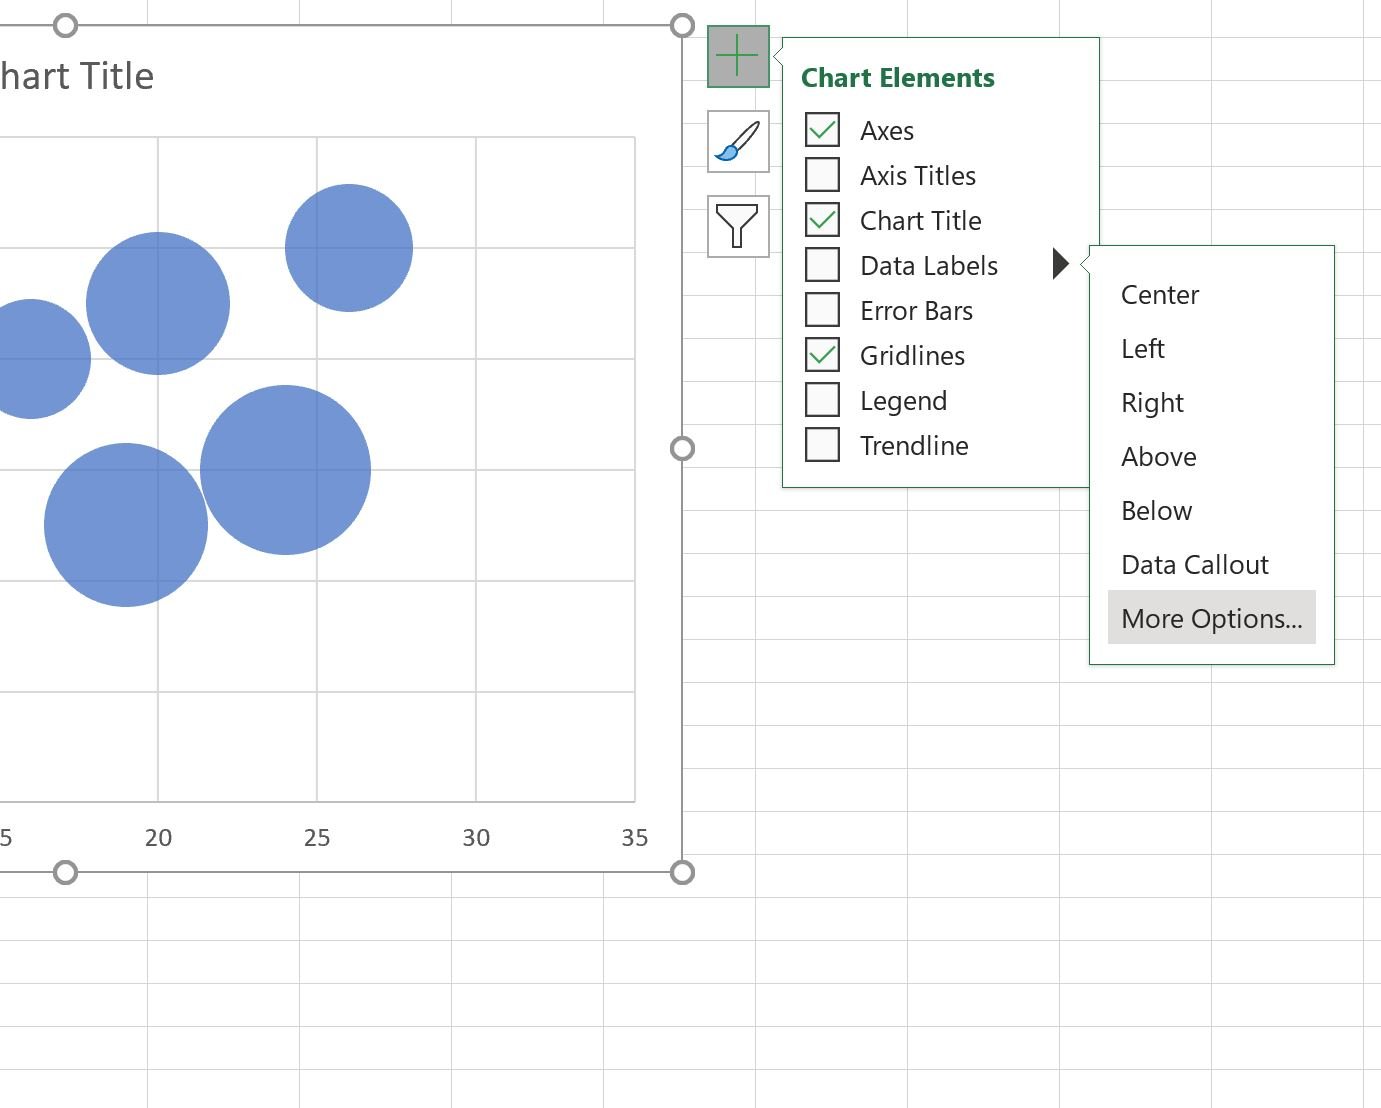
To add labels to the bubble chart, click anywhere on the chart and then click the green plus “+” sign in the top right corner.
Then click the arrow next to Data Labels and then click More Options in the dropdown menu:
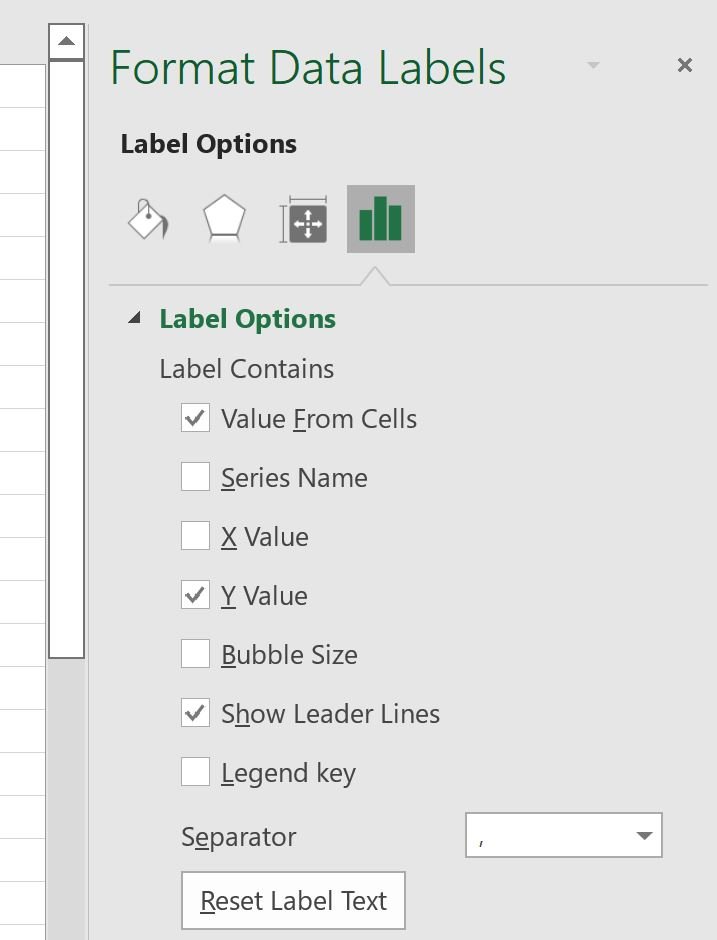
In the panel that appears on the right side of the screen, check the box next to Value From Cells within the Label Options group:
In the new window that appears, choose A2:A11 as the cell range that contains our labels:
Then click OK and in the Format Data Labels panel on the right side of the screen, uncheck the box next to Y Value and choose Center as Label Position.
The following labels will automatically be added to the bubble chart:
Step 4: Customize the Bubble Chart
Lastly, feel free to click on individual elements of the chart to add a title, add axis labels, modify label font size, and remove gridlines:
The final bubble chart is easy to read and we know exactly which bubbles represent which players.
Additional Resources
The following tutorials explain how to create other common visualizations in Excel:
How to Plot Multiple Lines in Excel
How to Create Side-by-Side Boxplots in Excel
How to Create an Ogive Graph in Excel