There are two ways to calculate an average while excluding outliers in Excel:
1. Calculate Average and Use TRIMMEAN to Exclude Outliers
2. Calculate Average and Use Interquartile Range to Exclude Outliers
We will use the following dataset in Excel to illustrate how to use both methods:
Method 1: Calculate Average and Use TRIMMEAN to Exclude Outliers
The TRIMMEAN function in Excel can be used to calculate the average of a range of values while excluding a certain percentage of observations from the top and bottom of the dataset.
For example, we can use the following formula to calculate the average value in column A while excluding a total of 20% of observations (10% from the top and 10% from the bottom):
=TRIMMEAN(A2:A16, 20%)
Since we have 15 values in our dataset 10% is 1.5, which is rounded down to 1. Thus, this formula will calculate the average of the values in the range while excluding the smallest value and the largest value:
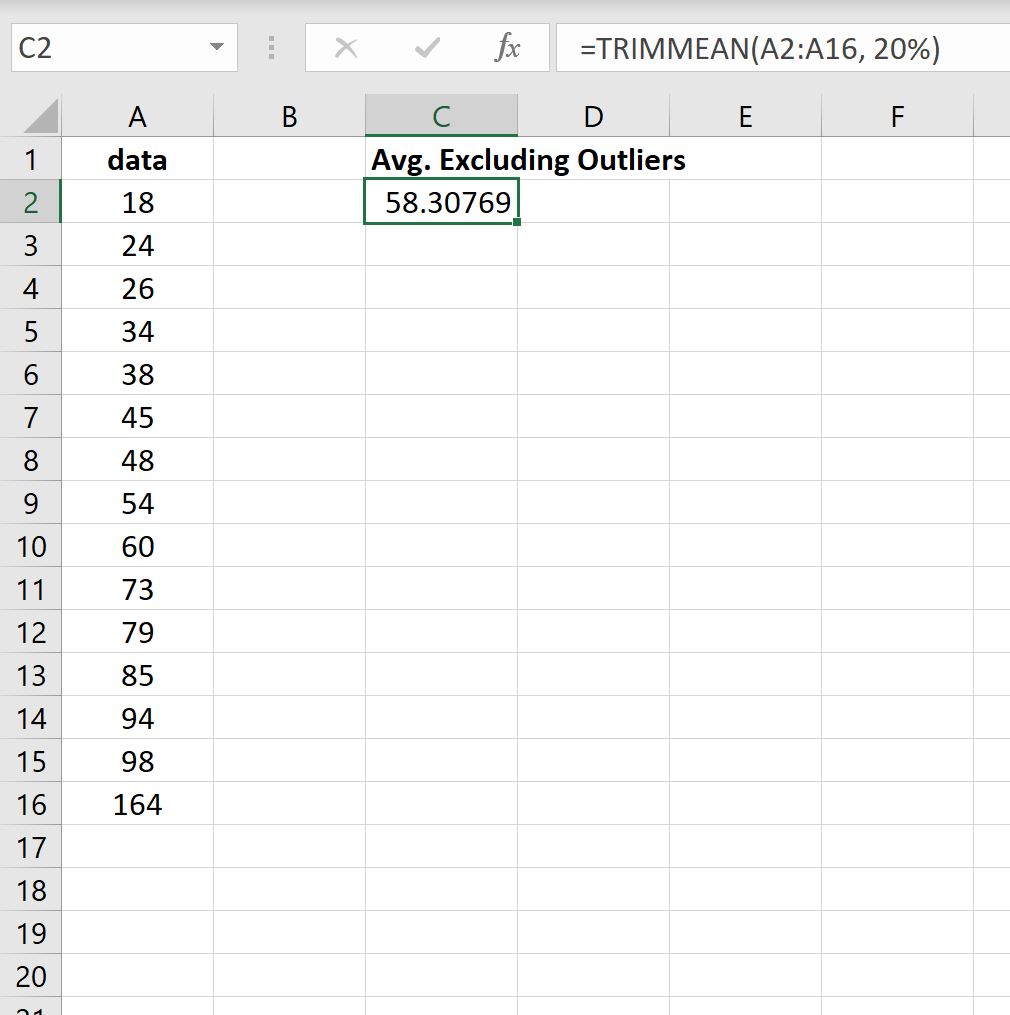
The average with outliers excluded turns out to be 58.30769.
Method 2: Calculate Average and Use Interquartile Range to Exclude Outliers
The interquartile range (IQR) is the difference between the 75th percentile (Q3) and the 25th percentile (Q1) in a dataset. It measures the spread of the middle 50% of values.
We can define an observation to be an outlier if it is 1.5 times the interquartile range greater than the third quartile (Q3) or 1.5 times the interquartile range less than the first quartile (Q1).
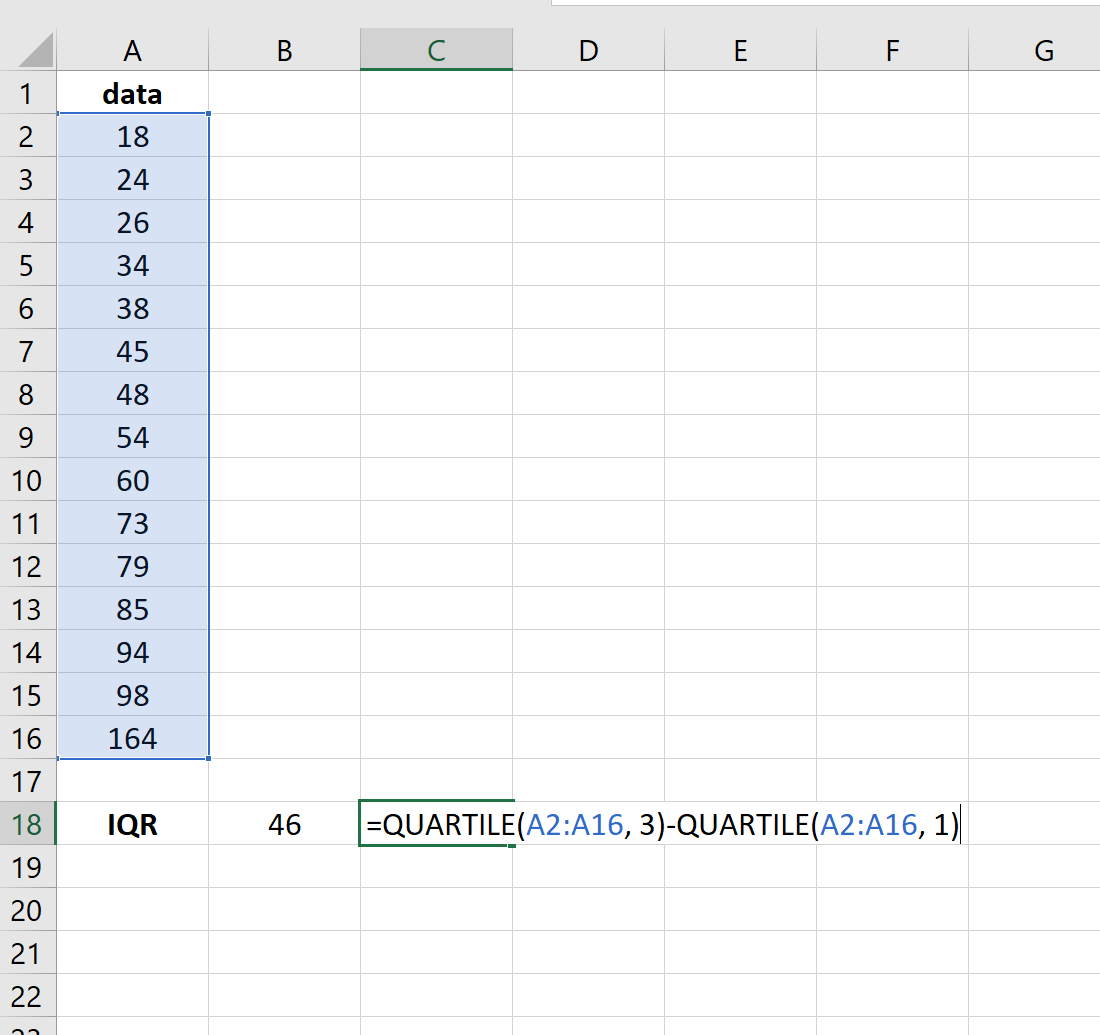
We can use the following formula to calculate the interquartile range for our dataset in Excel:
=QUARTILE(A2:A16,3)-QUARTILE(A2:A16,1)
The following screenshot shows how to use this formula:
Next, we can use the following formula to use the IQR to identify outlier values and assign a “1” to any value that is an outlier in the dataset:
=IF(OR(A2$A$2:$A$16,1)-1.5*$B$18,A2>QUARTILE($A$2:$A$16,3)+1.5*$B$18),1,0)
The following screenshot shows how to use this formula:
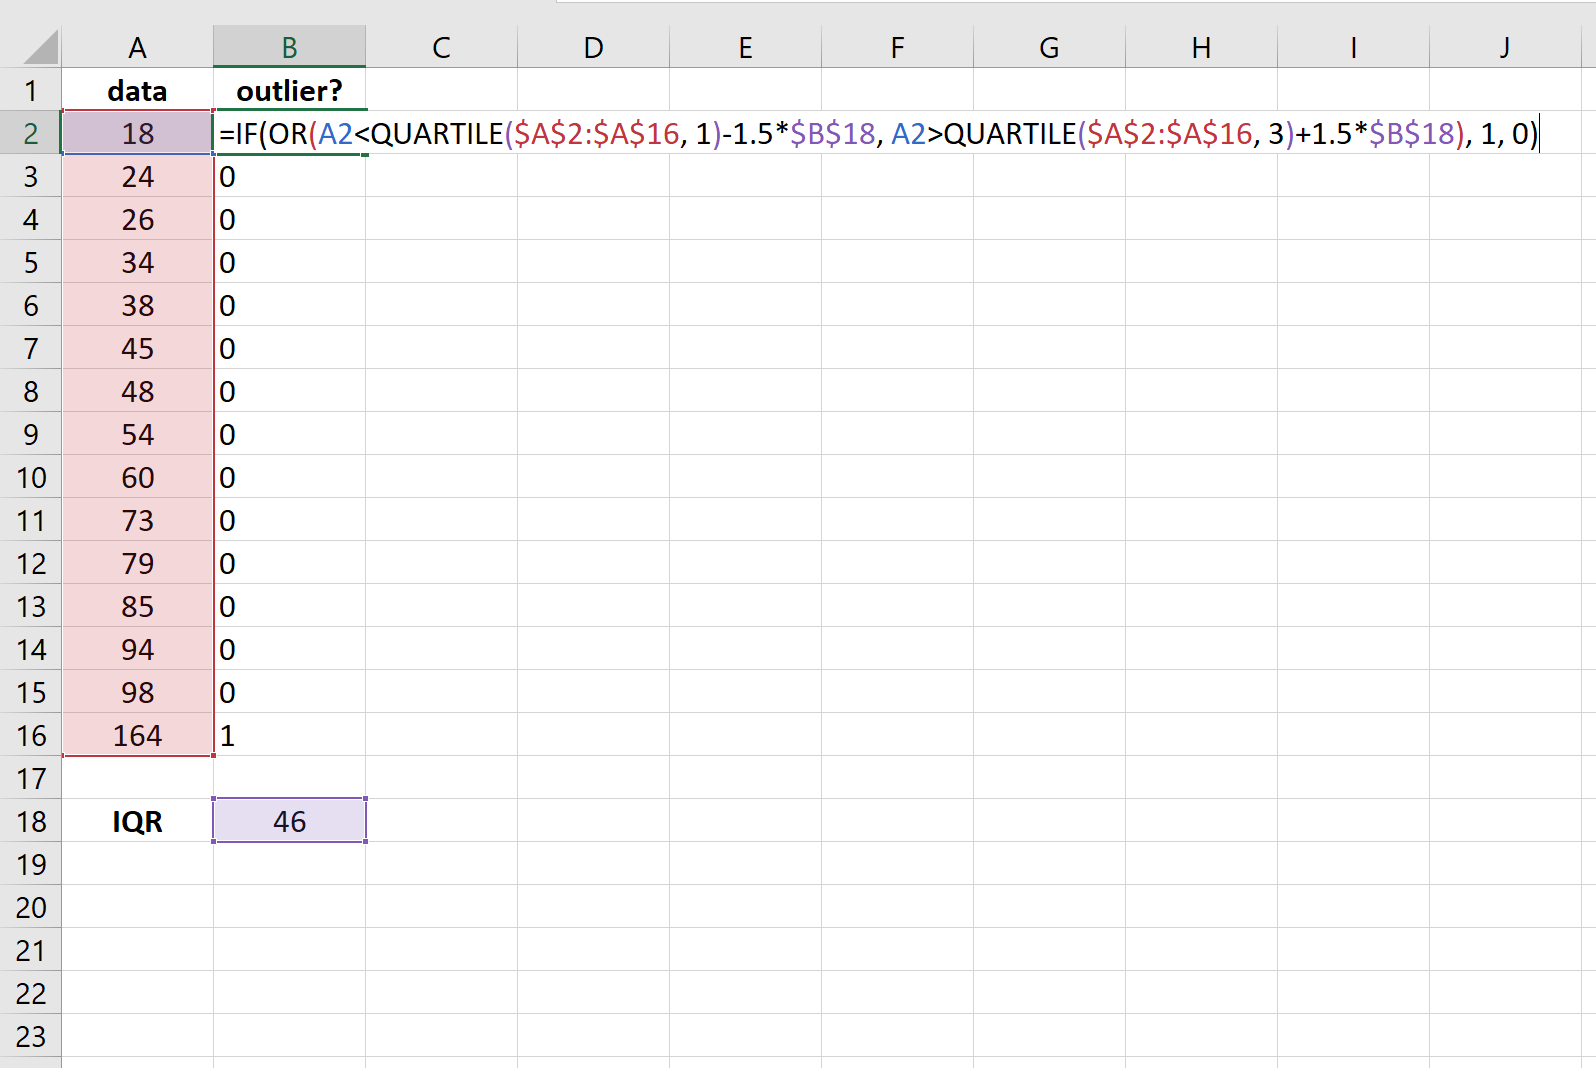
We see that only one value – 164 – turns out to be an outlier in this dataset.
Lastly, we can use the following formula to calculate the average of all values in the dataset that are not outliers:
=AVERAGEIF(B2:B16, 0, A2:A16)
The following screenshot shows how to use this formula:
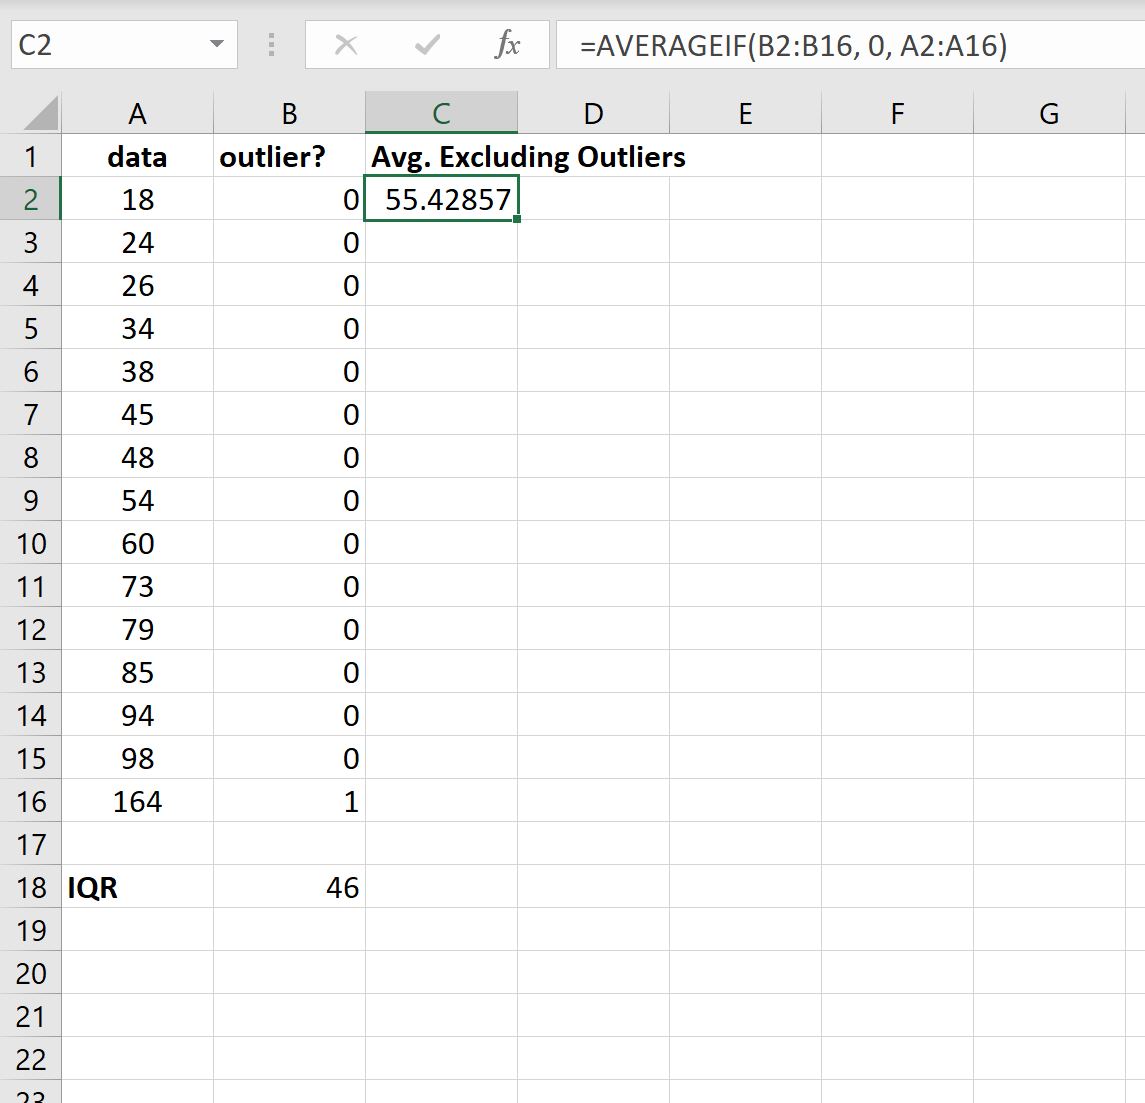
The average with outliers excluded turns out to be 55.42857.
Additional Resources
The following tutorials explain how to perform other common tasks in Excel:
How to Calculate the Interquartile Range (IQR) in Excel
How to Calculate the Average by Group in Excel
How to Calculate Weighted Moving Averages in Excel