One way to quantify the relationship between two variables is to use the Pearson correlation coefficient, which is a measure of the linear association between two variables.
It always takes on a value between -1 and 1 where:
- -1 indicates a perfectly negative linear correlation between two variables
- 0 indicates no linear correlation between two variables
- 1 indicates a perfectly positive linear correlation between two variables
To determine if a correlation coefficient is statistically significant, you can calculate the corresponding t-score and p-value.
The formula to calculate the t-score of a correlation coefficient (r) is:
t = r * √n-2 / √1-r2
The p-value is calculated as the corresponding two-sided p-value for the t-distribution with n-2 degrees of freedom.
Example: Correlation Test in R
To determine if the correlation coefficient between two variables is statistically significant, you can perform a correlation test in R using the following syntax:
cor.test(x, y, method=c(“pearson”, “kendall”, “spearman”))
where:
- x, y: Numeric vectors of data.
- method: Method used to calculate correlation between two vectors. Default is “pearson.”
For example, suppose we have the following two vectors in R:
x
Before we perform a correlation test between the two variables, we can create a quick scatterplot to view their relationship:
#create scatterplot
plot(x, y, pch=16)
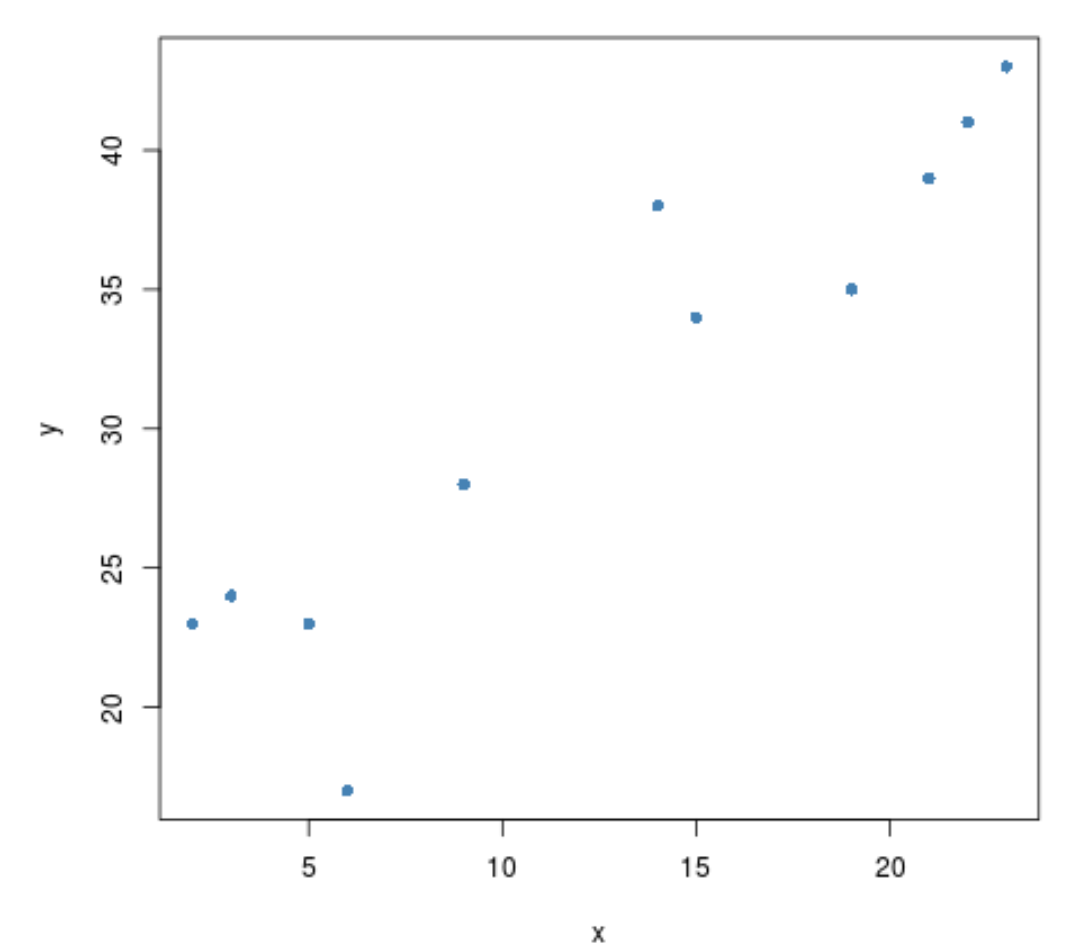
There appears to be a positive correlation between the two variables. That is, as one increases the other tends to increase as well.
To see if this correlation is statistically significant, we can perform a correlation test:
#perform correlation test between the two vectors
cor.test(x, y)

	Pearson's product-moment correlation

data:  x and y
t = 7.8756, df = 10, p-value = 1.35e-05
alternative hypothesis: true correlation is not equal to 0
95 percent confidence interval:
 0.7575203 0.9799783
sample estimates:
      cor
0.9279869
The correlation coefficient between the two vectors turns out to be 0.9279869.
The test statistic turns out to be 7.8756 and the corresponding p-value is 1.35e-05.
Since this value is less than .05, we have sufficient evidence to say that the correlation between the two variables is statistically significant.
Additional Resources
The following tutorials provide additional information about correlation coefficients:
An Introduction to the Pearson Correlation Coefficient
What is Considered to Be a “Strong” Correlation?
The Five Assumptions for Pearson Correlation