Logistic regression is a type of regression we can use when the response variable is binary.
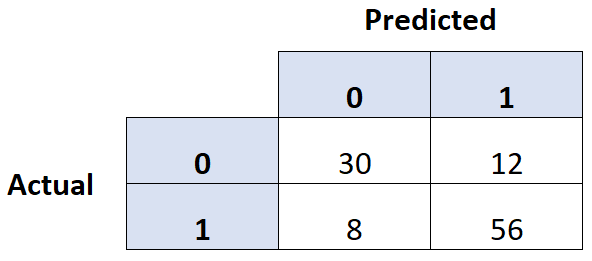
One common way to evaluate the quality of a logistic regression model is to create a confusion matrix, which is a 2×2 table that shows the predicted values from the model vs. the actual values from the test dataset.
To create a confusion matrix for a logistic regression model in Python, we can use the confusion_matrix() function from the sklearn package:
from sklearn import metrics
metrics.confusion_matrix(y_actual, y_predicted)
The following example shows how to use this function to create a confusion matrix for a logistic regression model in Python.
Example: Creating a Confusion Matrix in Python
Suppose we have the following two arrays that contain the actual values for a response variable along with the predicted values by a logistic regression model:
#define array of actual values
y_actual = [0, 0, 0, 0, 0, 0, 0, 0, 0, 0, 1, 1, 1, 1, 1, 1, 1, 1, 1, 1]

#define array of predicted values
y_predicted = [0, 0, 1, 0, 0, 1, 1, 0, 0, 1, 0, 0, 1, 1, 1, 1, 1, 1, 1, 1]
We can use the confusion_matrix() function from sklearn to create a confusion matrix for this data:
from sklearn import metrics

#create confusion matrix
c_matrix = metrics.confusion_matrix(y_actual, y_predicted)

#print confusion matrix
print(c_matrix)

[[6 4]
 [2 8]]
If we’d like, we can use the crosstab() function from pandas to make a more visually appealing confusion matrix:
import pandas as pd

y_actual = pd.Series(y_actual, name='Actual')
y_predicted = pd.Series(y_predicted, name='Predicted')

#create confusion matrix
print(pd.crosstab(y_actual, y_predicted))

Predicted  0  1
Actual
0          6  4
1          2  8
The columns show the predicted values for the response variable and the rows show the actual values.
We can also calculate the accuracy, precision, and recall using functions from the sklearn package:
#print accuracy of model
print(metrics.accuracy_score(y_actual, y_predicted))

0.7

#print precision value of model
print(metrics.precision_score(y_actual, y_predicted))

0.667

#print recall value of model
print(metrics.recall_score(y_actual, y_predicted))

0.8
Here is a quick refresher on accuracy, precision, and recall:
- Accuracy: Percentage of correct predictions
- Precision: Correct positive predictions relative to total positive predictions
- Recall: Correct positive predictions relative to total actual positives
And here is how each of these metrics was actually calculated in our example:
- Accuracy: (6+8) / (6+4+2+8) = 0.7
- Precision: 8 / (8+4) = 0.667
- Recall: 8 / (2+8) = 0.8
Additional Resources
Introduction to Logistic Regression
The 3 Types of Logistic Regression
Logistic Regression vs. Linear Regression