A Chi-Square Test of Independence is used to determine whether or not there is a significant association between two categorical variables.
This tutorial explains how to perform a Chi-Square Test of Independence in Excel.
Example: Chi-Square Test of Independence in Excel
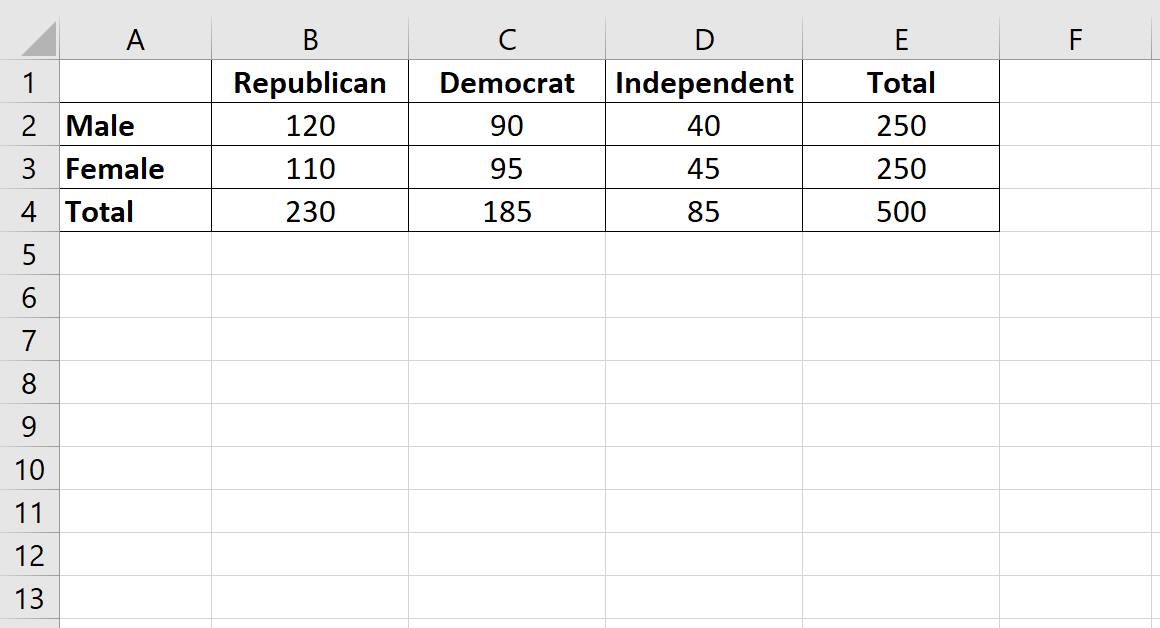
Suppose we want to know whether or not gender is associated with political party preference. We take a simple random sample of 500 voters and survey them on their political party preference. The following table shows the results of the survey:
Use the following steps to perform a Chi-Square test of independence to determine if gender is associated with political party preference.
Step 1: Define the hypotheses.
We will perform the Chi-Square test of independence using the following hypotheses:
- H0: Gender and political party preference are independent.
- H1: Gender and political party preference are not independent.
Step 2: Calculate the expected values.
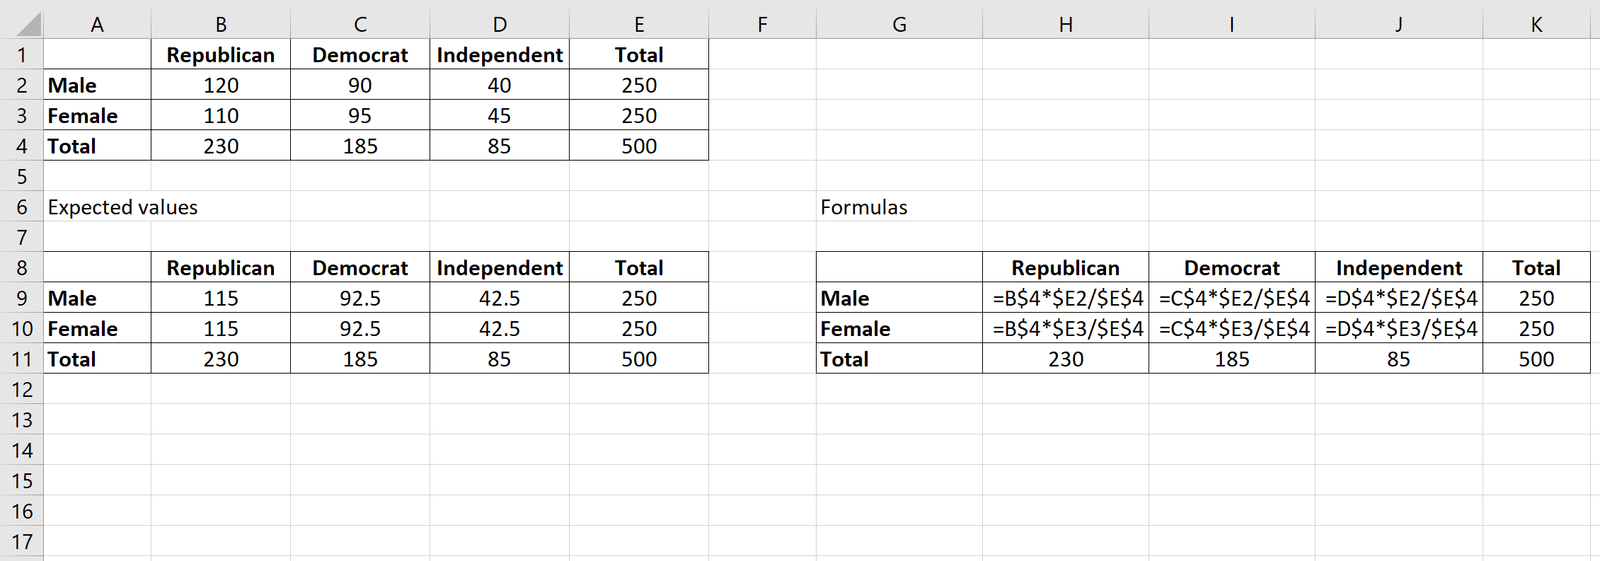
Next, we will calculate the expected values for each cell in the contingency table using the following formula:
Expected value = (row sum * column sum) / table sum.
For example, the expected value for Male Republicans is: (230*250) / 500 = 115.
We can repeat this formula to obtain the expected value for each cell in the table:
Step 3: Calculate (O-E)2 / E for each cell in the table.
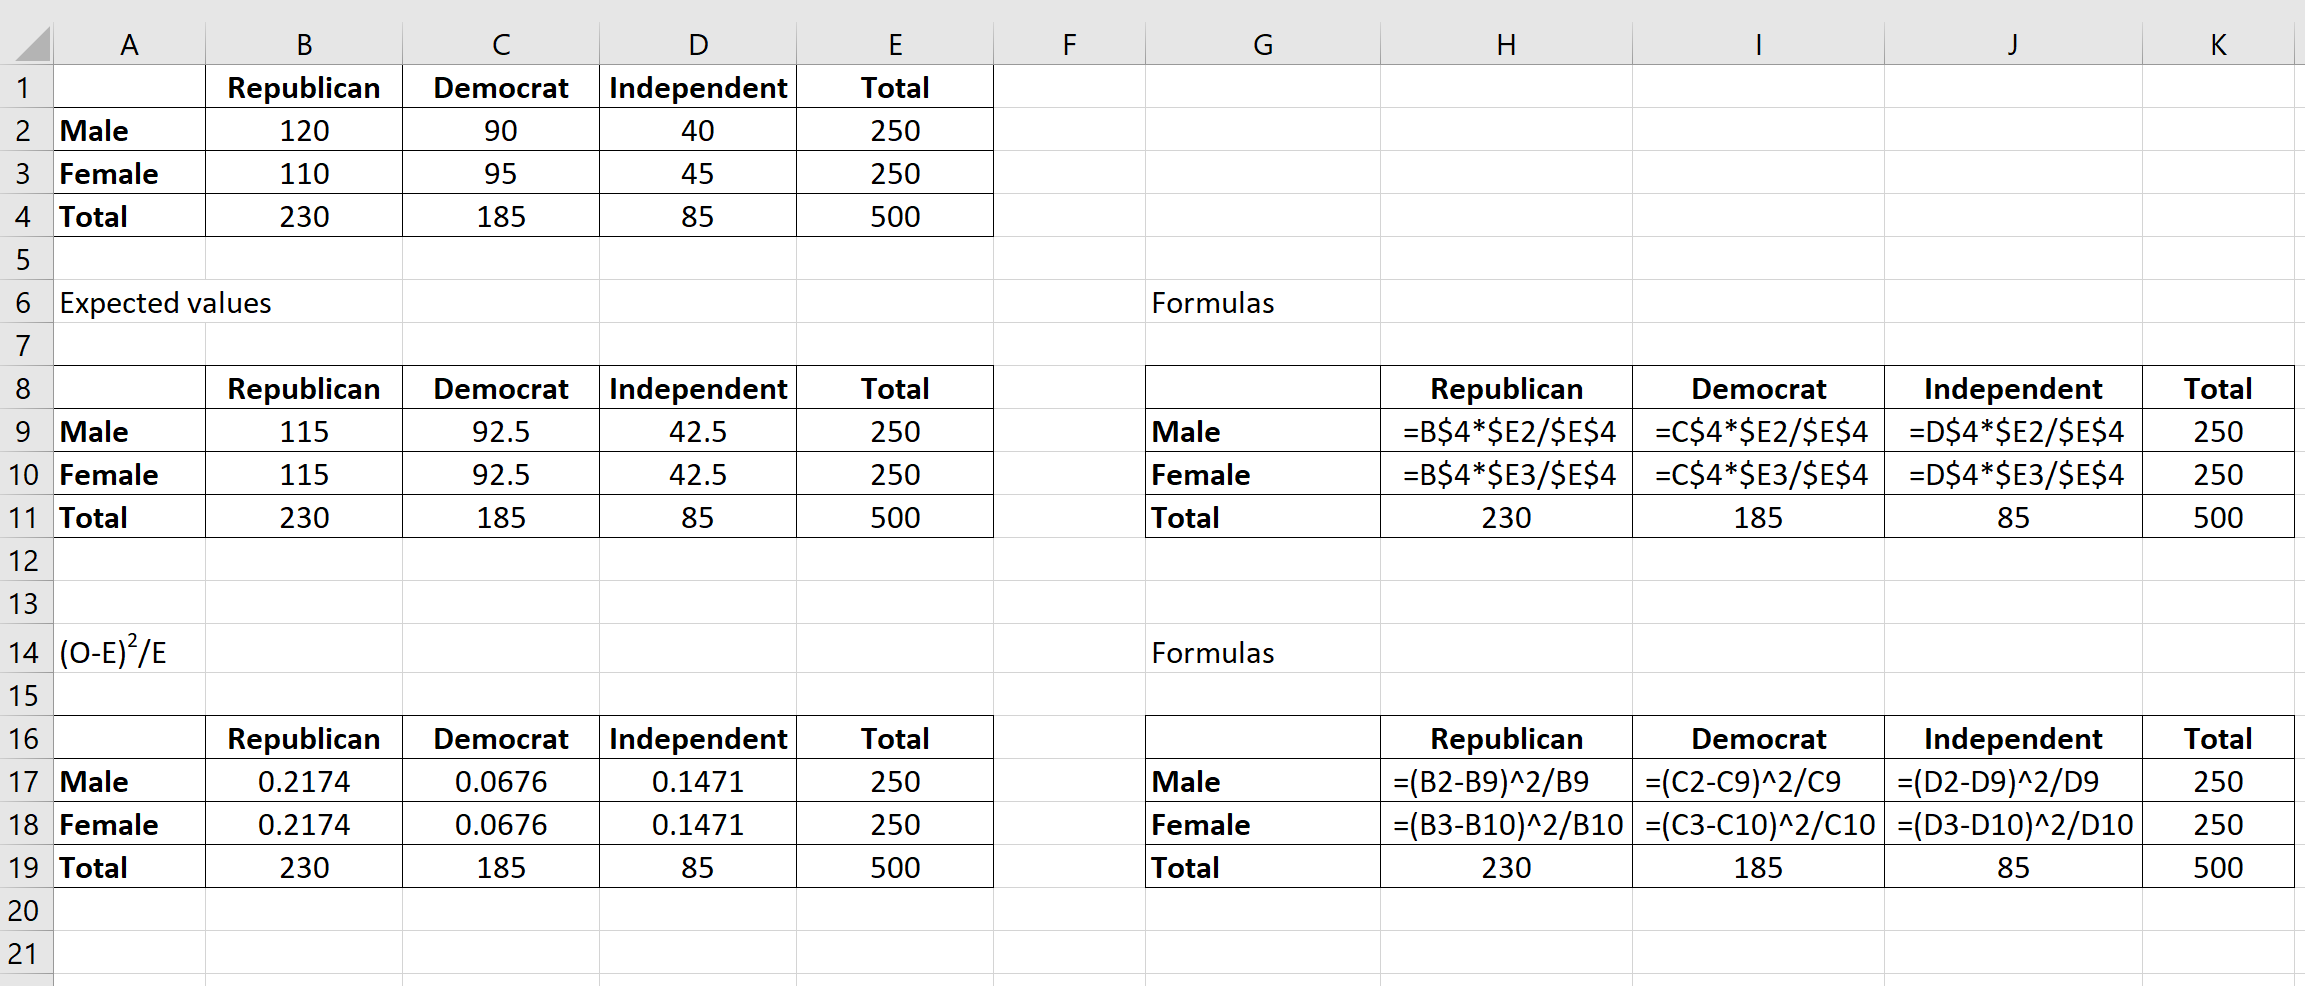
Next we will calculate (O-E)2 / E for each cell in the table where:
- O: observed value
- E: expected value
For example, Male Republicans would have a value of: (120-115)2 /115 = 0.2174.
We can repeat this formula for each cell in the table:
Step 4: Calculate the test statistic X2 and the corresponding p-value.
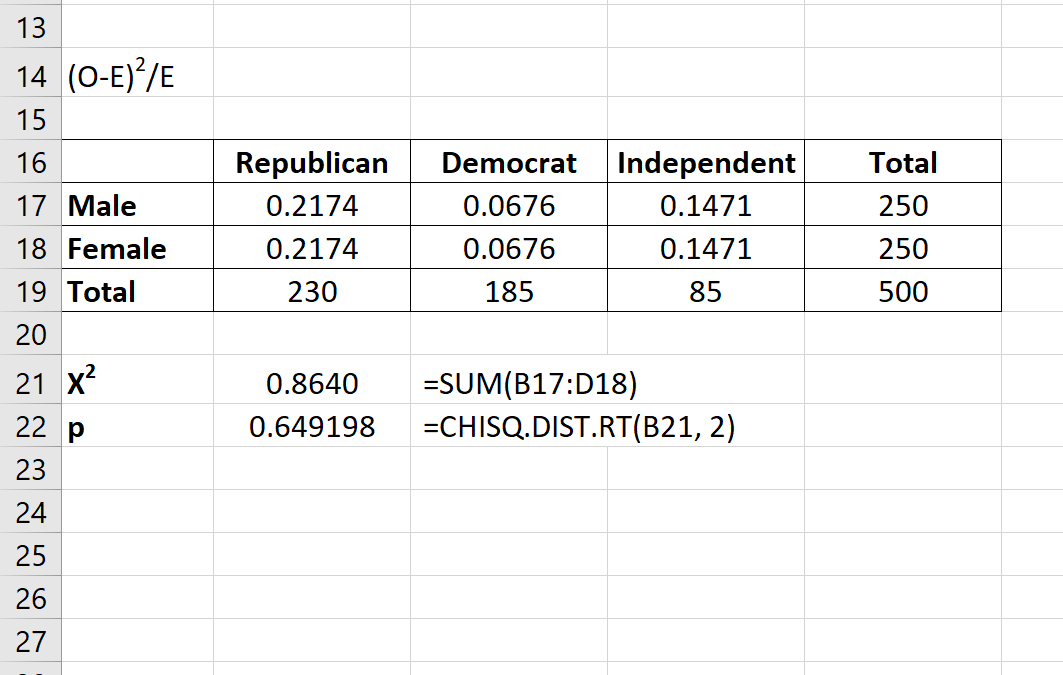
The test statistic X2 is simply the sum of the values in the last table.
The p-value that corresponds to the test statistic X2 can be found by using the formula :
=CHISQ.DIST.RT(x, deg_freedom)
where:
- x: test statistic X2
- deg_freedom: degrees of freedom, calculated as (#rows-1) * (#columns-1)
The test statistic X2 turns out to be 0.8640 and the corresponding p-value is 0.649198.
Step 5: Draw a conclusion.
Since this p-value is not less than 0.05, we fail to reject the null hypothesis. This means we do not have sufficient evidence to say that there is an association between gender and political party preference.
Note: You can also perform this entire test by using the Chi-Square Test of Independence Calculator.