You can use the following basic syntax to calculate and plot a cumulative distribution function (CDF) in R:
#calculate empirical CDF of data
p = ecdf(data)

#plot CDF
plot(p)
The following examples show how to use this syntax in practice.
Example 1: Calculate & Plot CDF of Raw Data
The following code shows how to calculate and plot a CDF of a random dataset in R:
#create some data
data = rnorm(100)

#calculate empirical CDF of data
p = ecdf(data)

#plot CDF
plot(p, xlab='x', ylab='CDF', main='CDF of Data')

The x-axis shows the raw data values and the y-axis shows the corresponding CDF values.
Example 2: Calculate & Plot CDF of Known Distribution
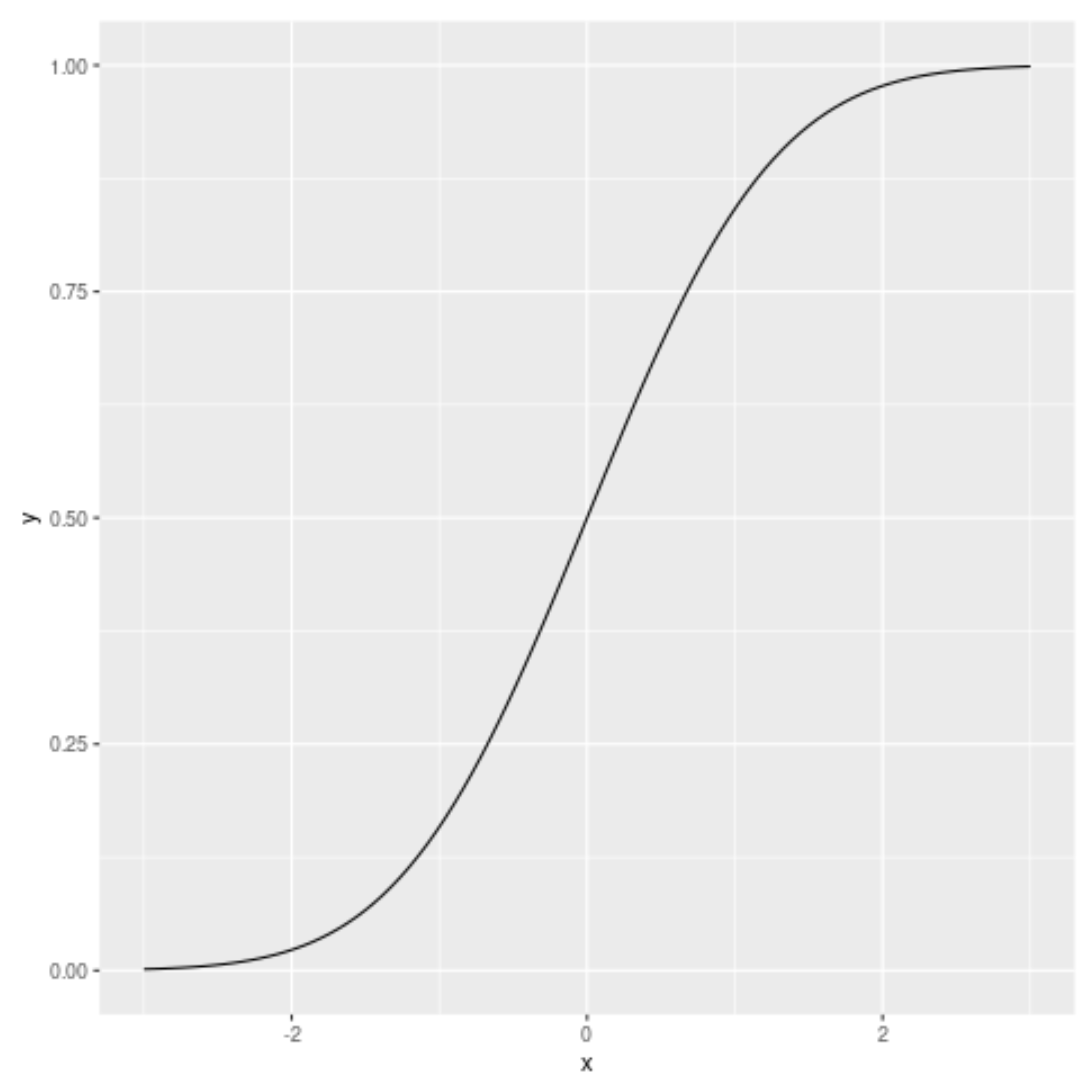
The following code shows how to calculate and plot a CDF of the standard normal distribution:
curve(pnorm, from = -3, to = 3)

Alternatively, you can create the same plot using ggplot2:
library(ggplot2)

ggplot(data.frame(x = c(-3, 3)), aes(x = x)) +
  stat_function(fun = pnorm)
Additional Resources
CDF vs. PDF: What’s the Difference?
How to Plot a CDF in Excel