A box plot is a type of plot that we can use to visualize the five number summary of a dataset, which includes:
- The minimum
- The first quartile
- The median
- The third quartile
- The maximum
This tutorial explains how to create a box plot in Google Sheets.
Example: Box Plots in Google Sheets
Use the following steps to create a box plot in Google Sheets.
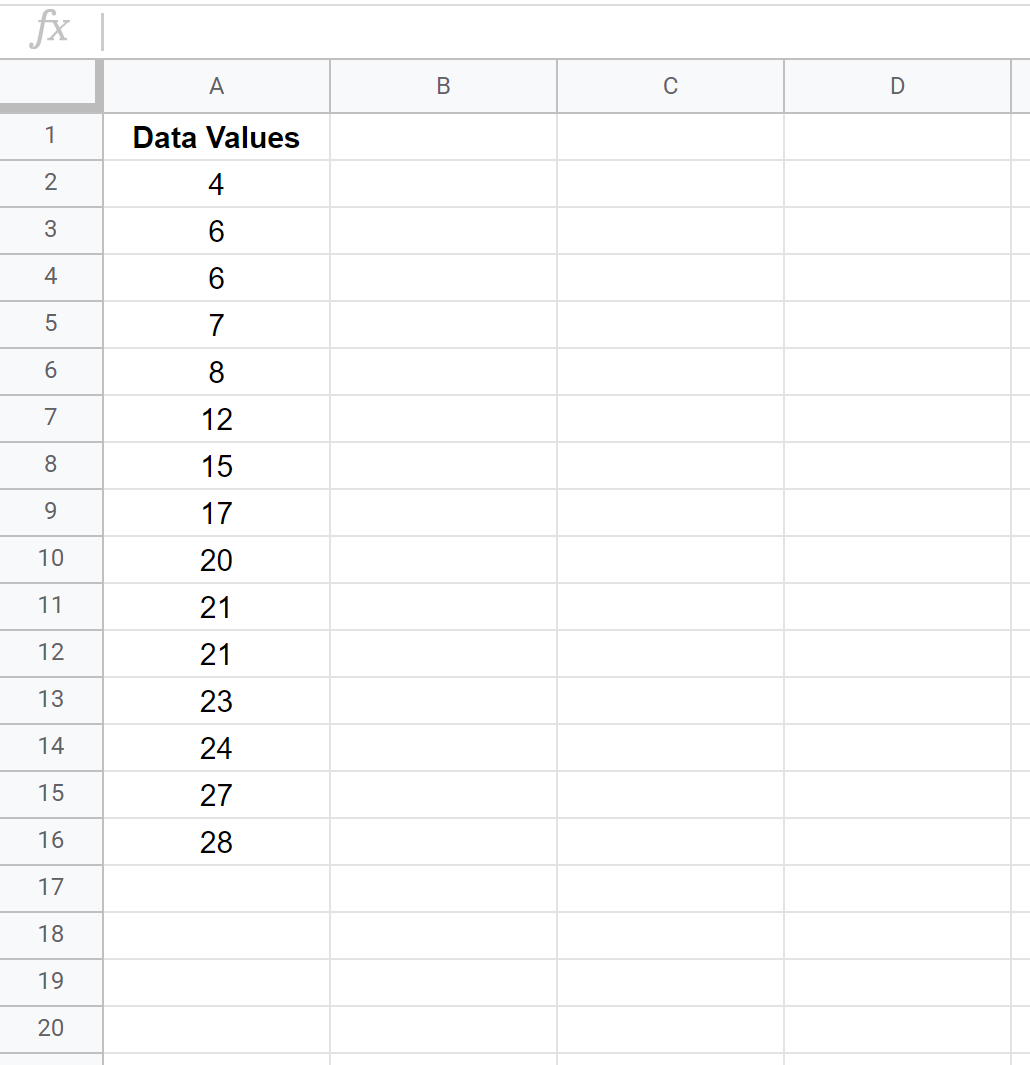
Step 1: Enter the data.
First enter the values of your dataset into one column:
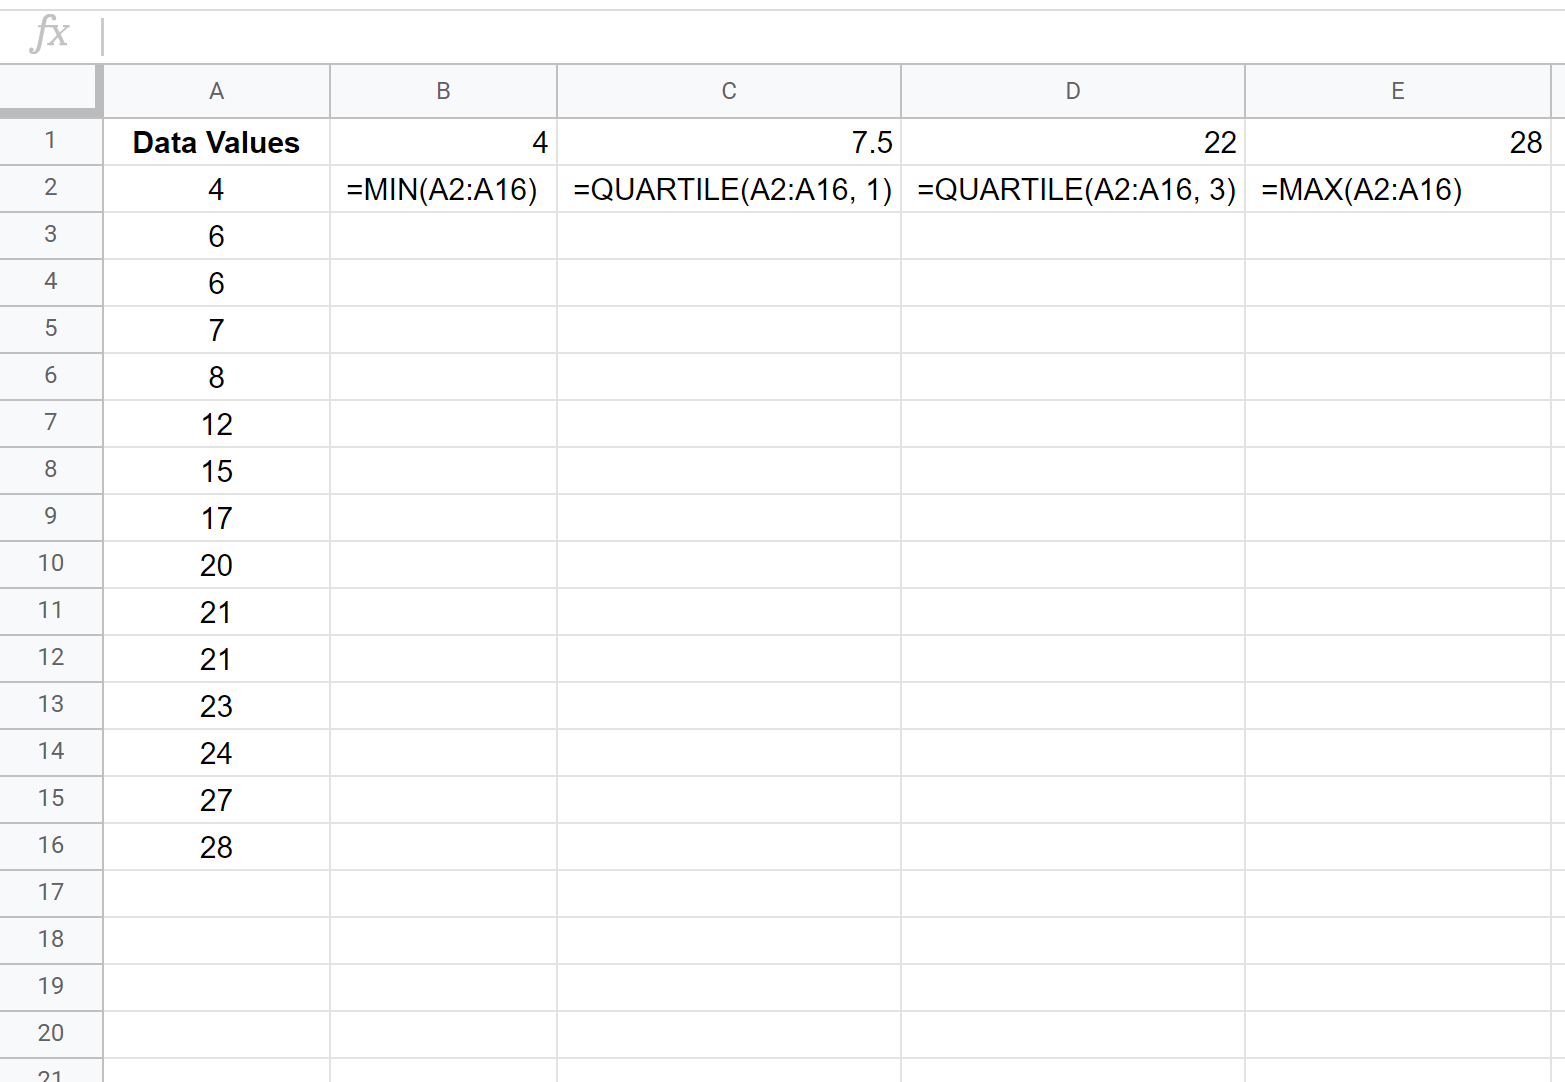
Step 2: Calculate the five number summary
Typically we need to know the median value of a dataset to create a box plot, but as we’ll see in the next step we will instead use a candlestick chart to create something that looks like a boxplot since Google Sheets doesn’t have a box plot chart option.
In order to create a candlestick chart we only need to know the minimum, 1st quartile, 3rd quartile, and maximum value of a dataset. The following image shows the formulas to use to calculate these numbers:
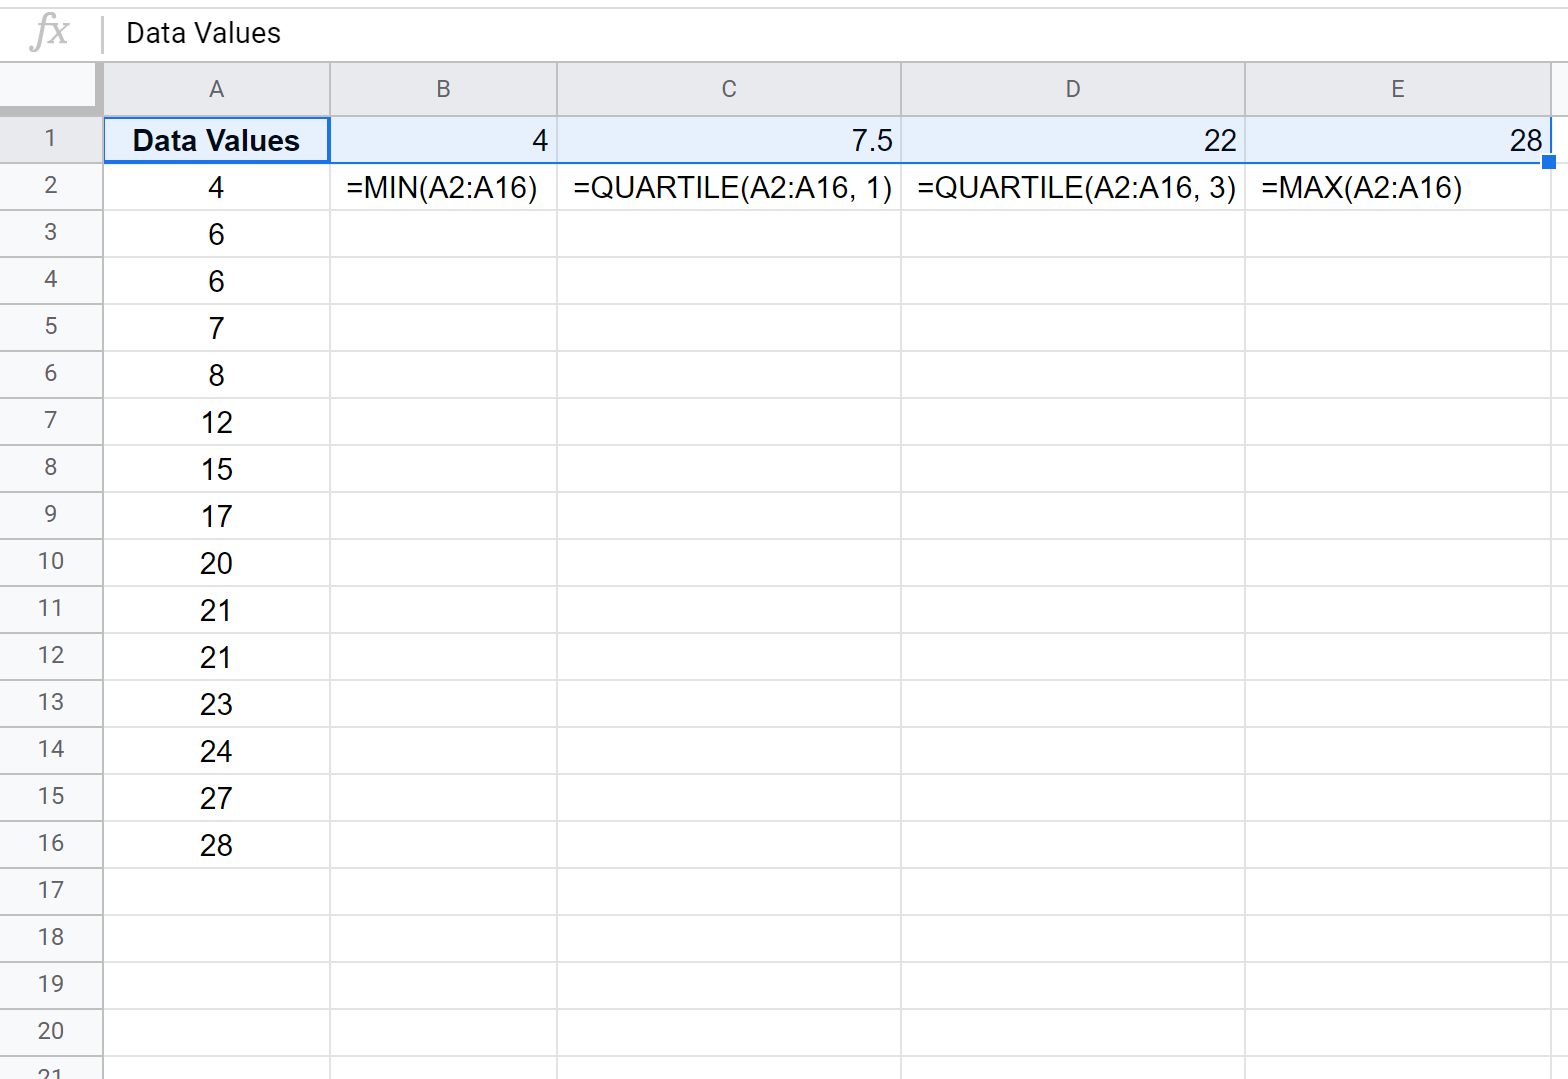
Step 3: Create the box plot.
Next, highlight the values in columns A through E in the first row:
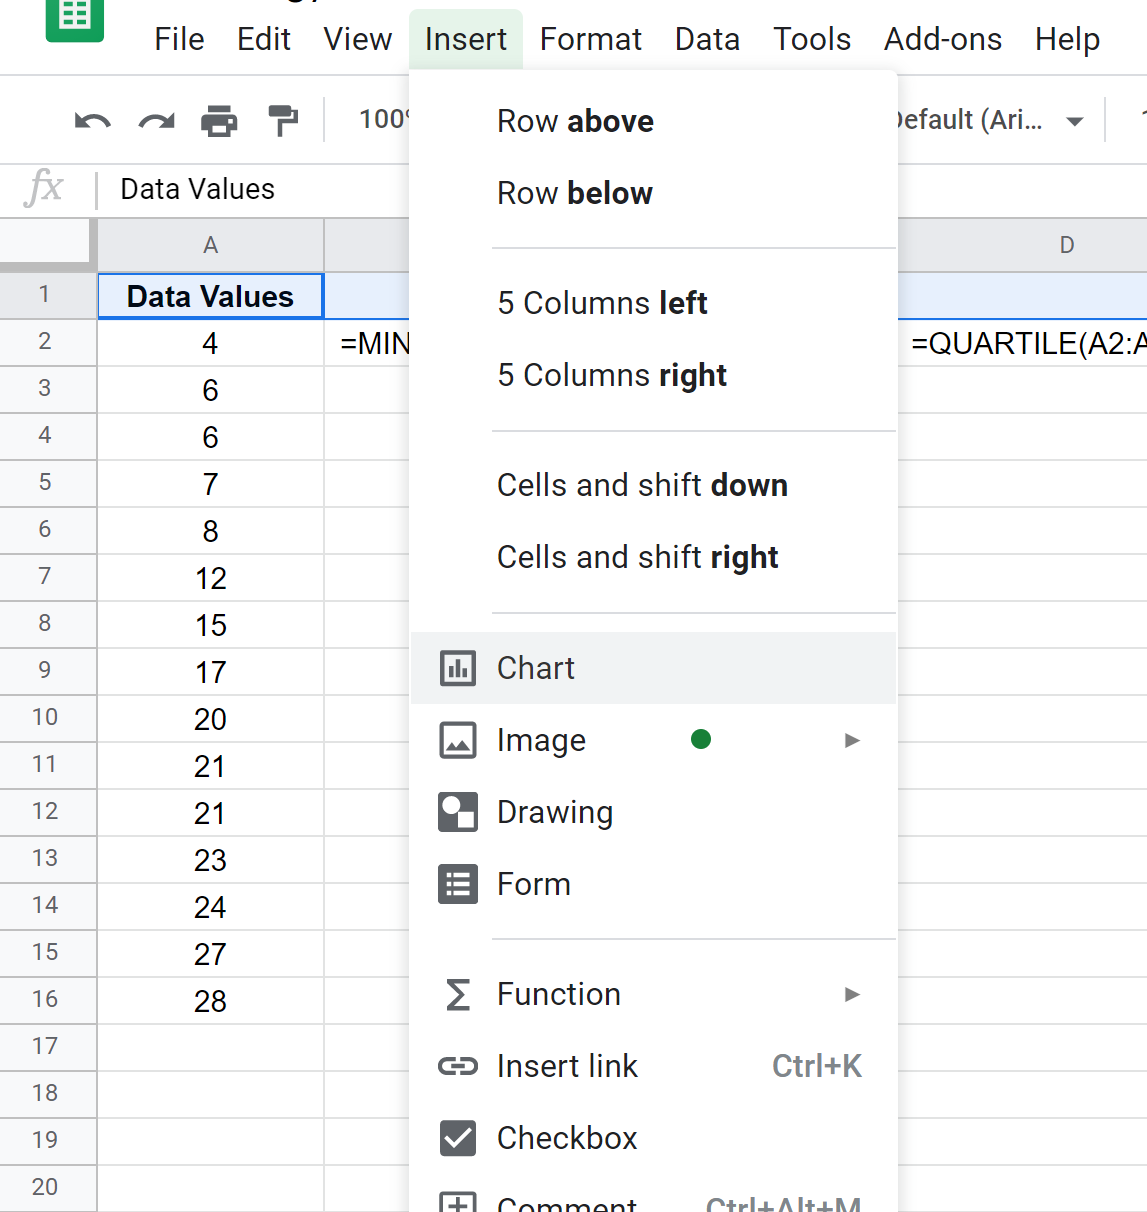
Click the Insert tab along the top ribbon, then click Chart in the dropdown menu:
In the Chart Editor window that appears on the right side of the screen, click the dropdown menu for Chart type and then click the chart type titled Candlestick chart.
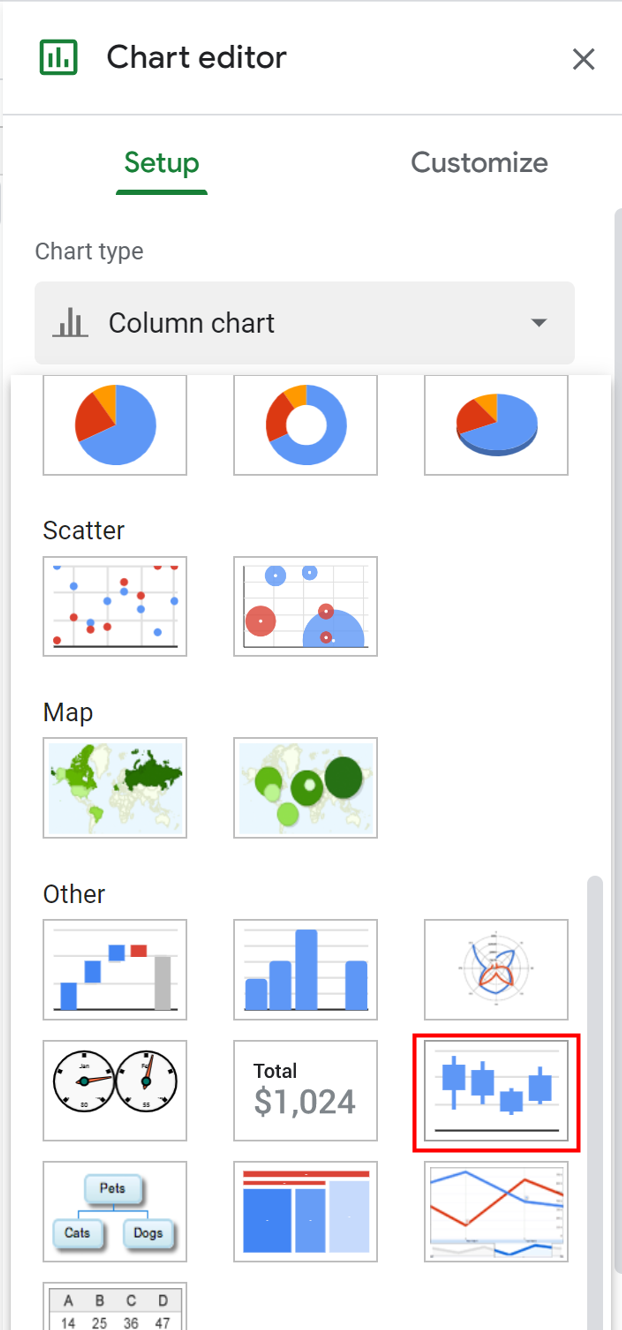
Once you click this, the following chart will appear:
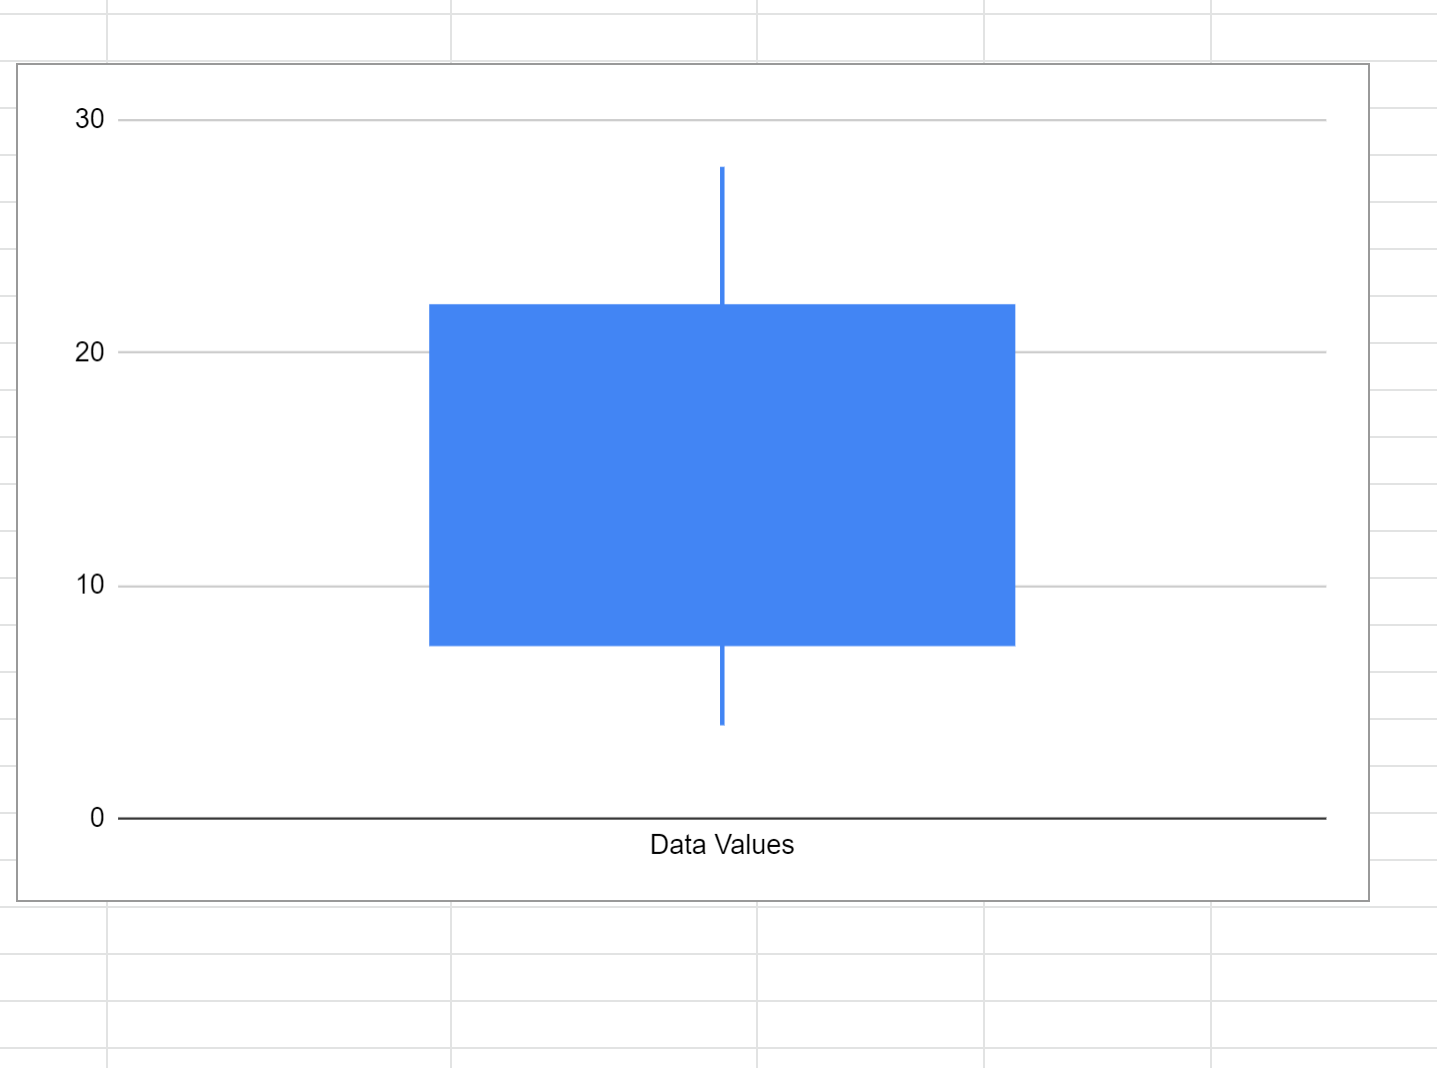
The way to interpret the chart is as follows:
- The top line extends to the maximum value of the dataset (28)
- The top of the box represents the value of the third quartile (22)
- The bottom of the box represents the value of the first quartile (7.5)
- The bottom line extends to the minimum value of the dataset (4)
Within the Customize subsection of the Chart Editor window on the right side of the screen you can also modify the plot to include titles, adjust gridlines, and modify the axis labels.
Additional Resources
The following tutorials explain how to create other common charts in Google Sheets:
How to Create a Pie Chart in Google Sheets
How to Create a Bubble Chart in Google Sheets
How to Create a Dot Plot in Google Sheets