An area chart is a type of chart that displays the quantitative values of several variables over a certain time period.
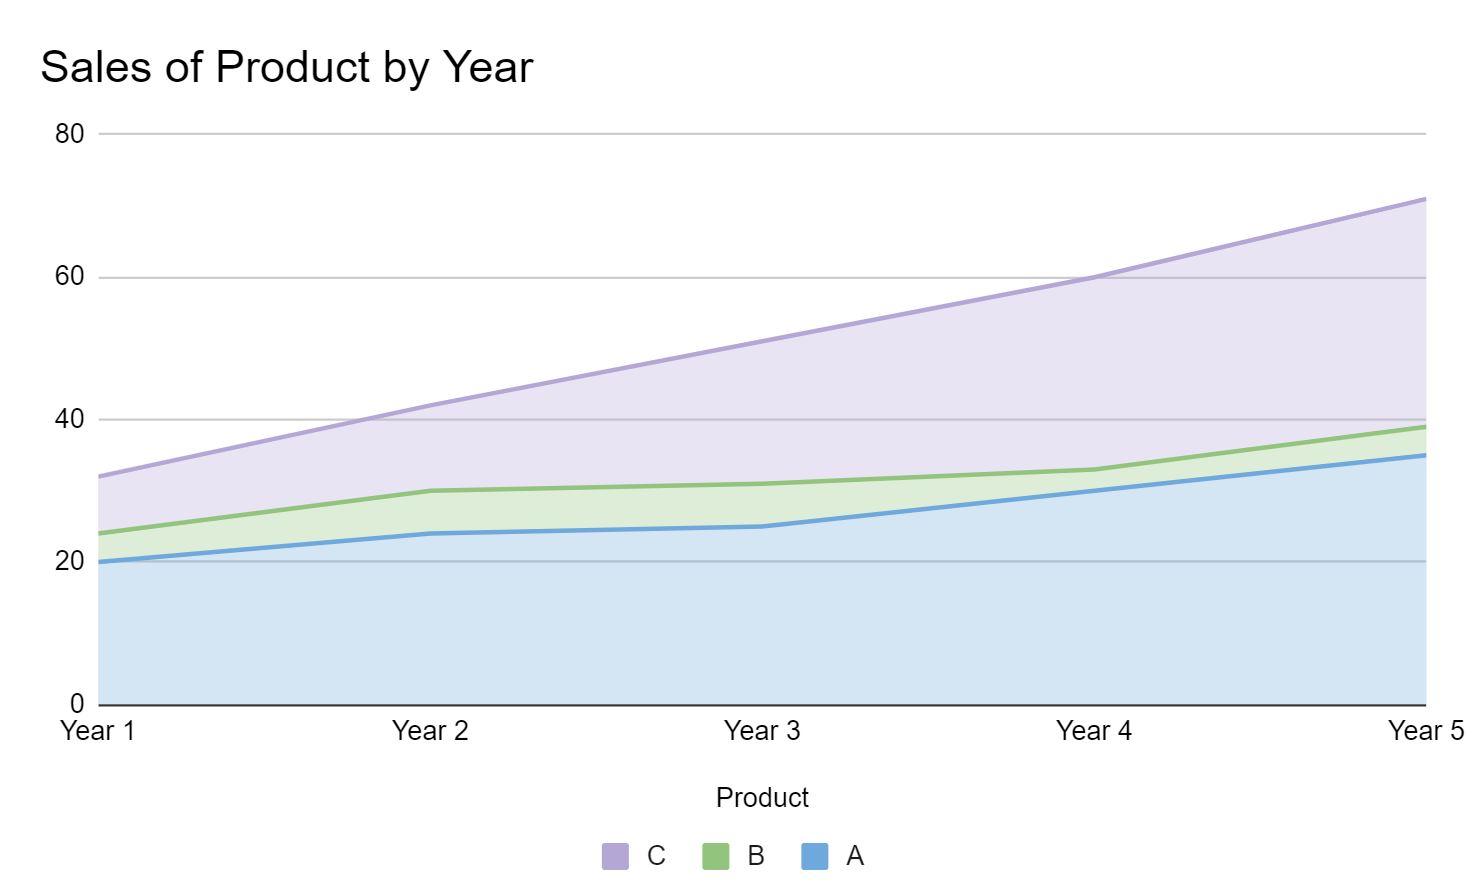
This tutorial provides a step-by-step example of how to create the following area chart in Google Sheets:
Step 1: Create the Data
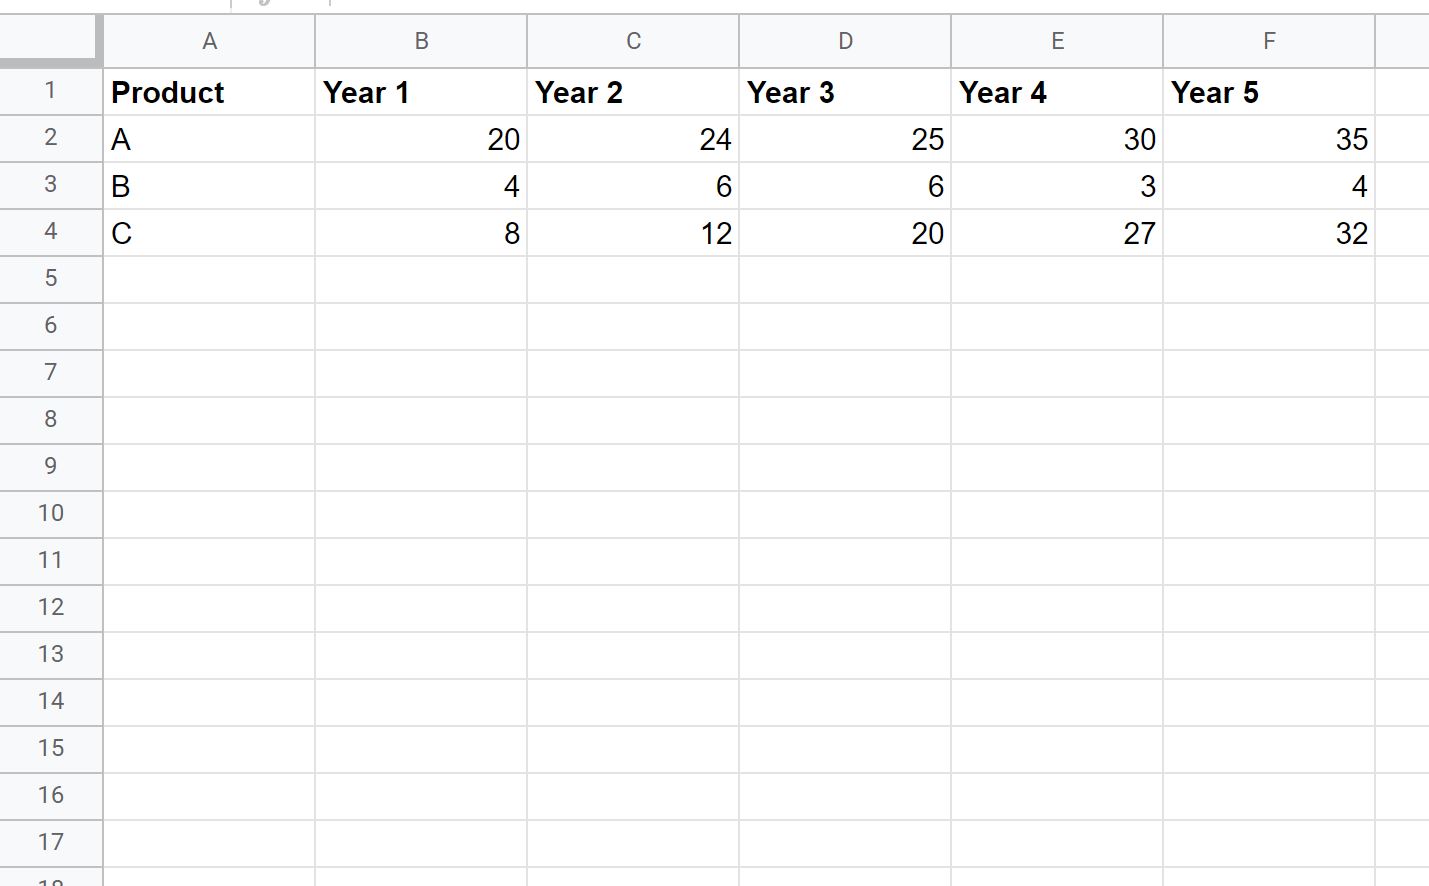
First, let’s create a dataset that shows the sales of three different products during a 5-year period:
Step 2: Create the Area Chart
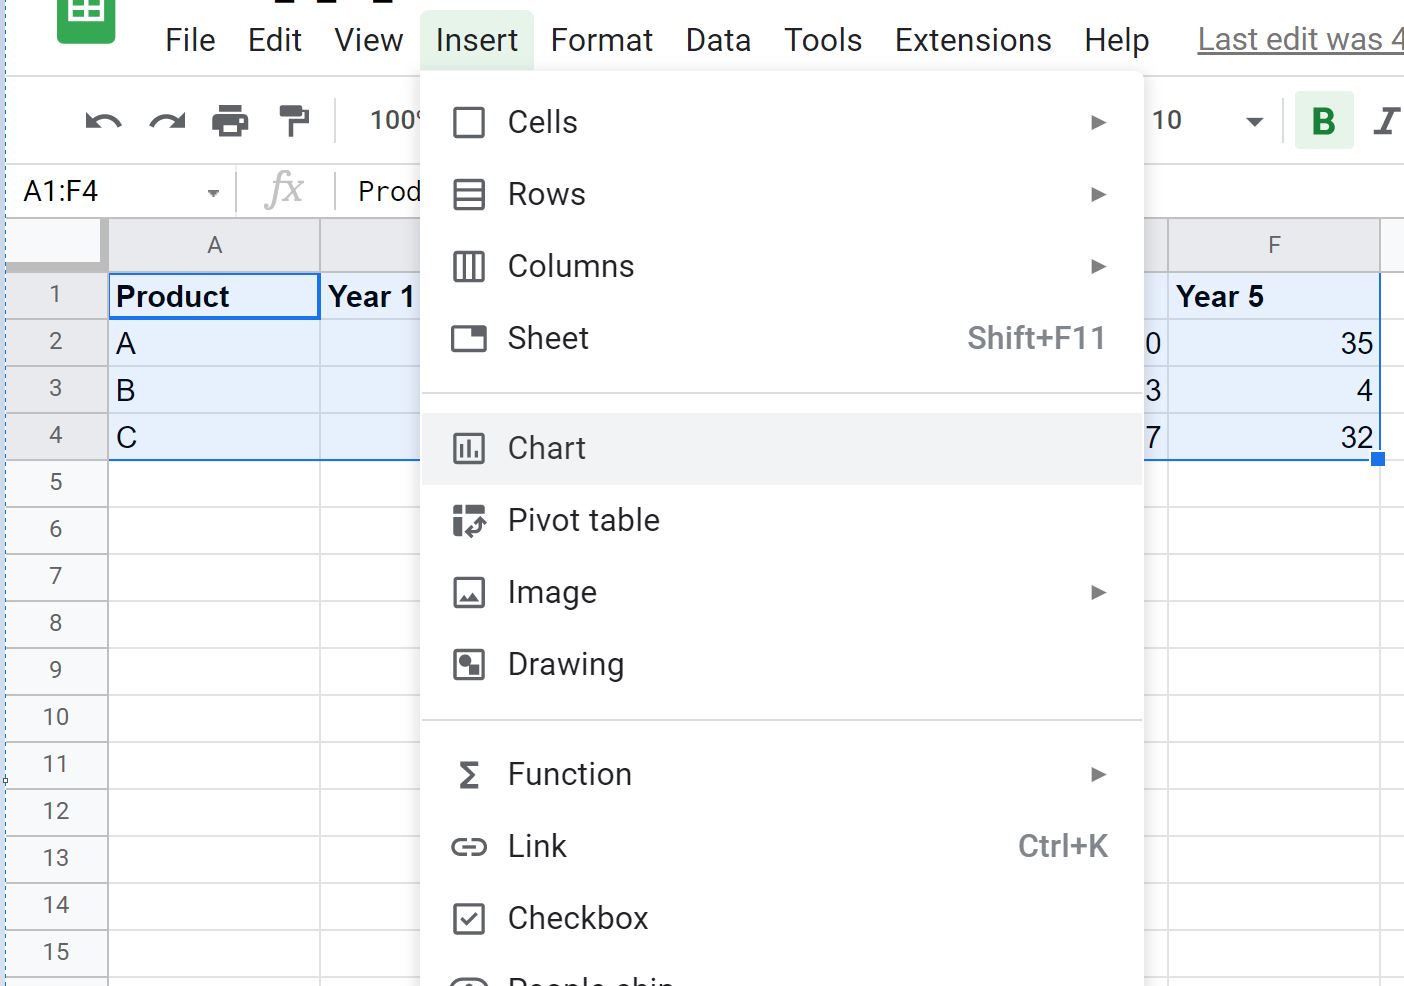
Next, highlight the cells in the range A1:F4. Then click Insert along the top ribbon and then click Chart:
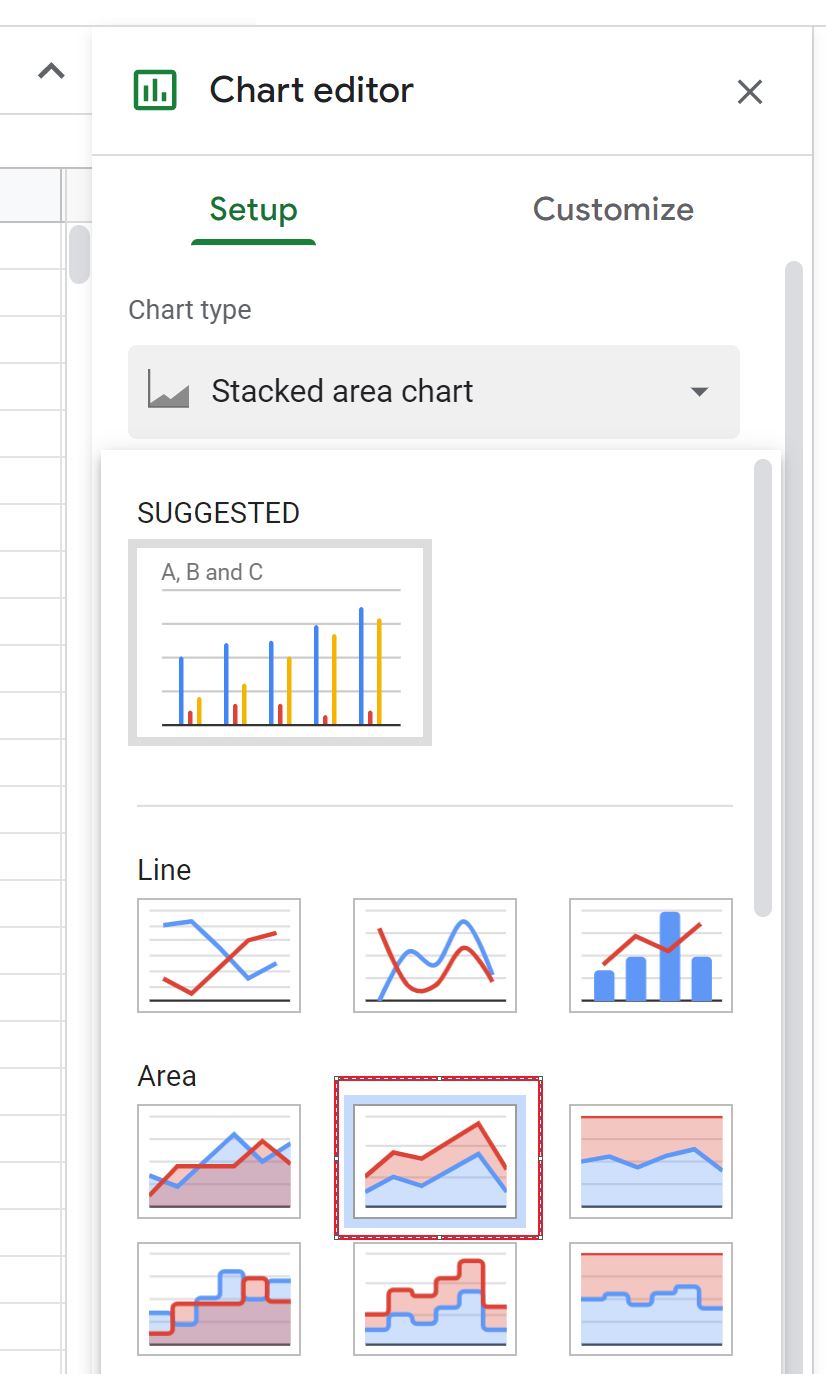
In the Chart editor panel that appears on the right side of the screen, click the dropdown menu next to Chart type and click on the icon titled Stacked area chart:
The following area chart will automatically be created:
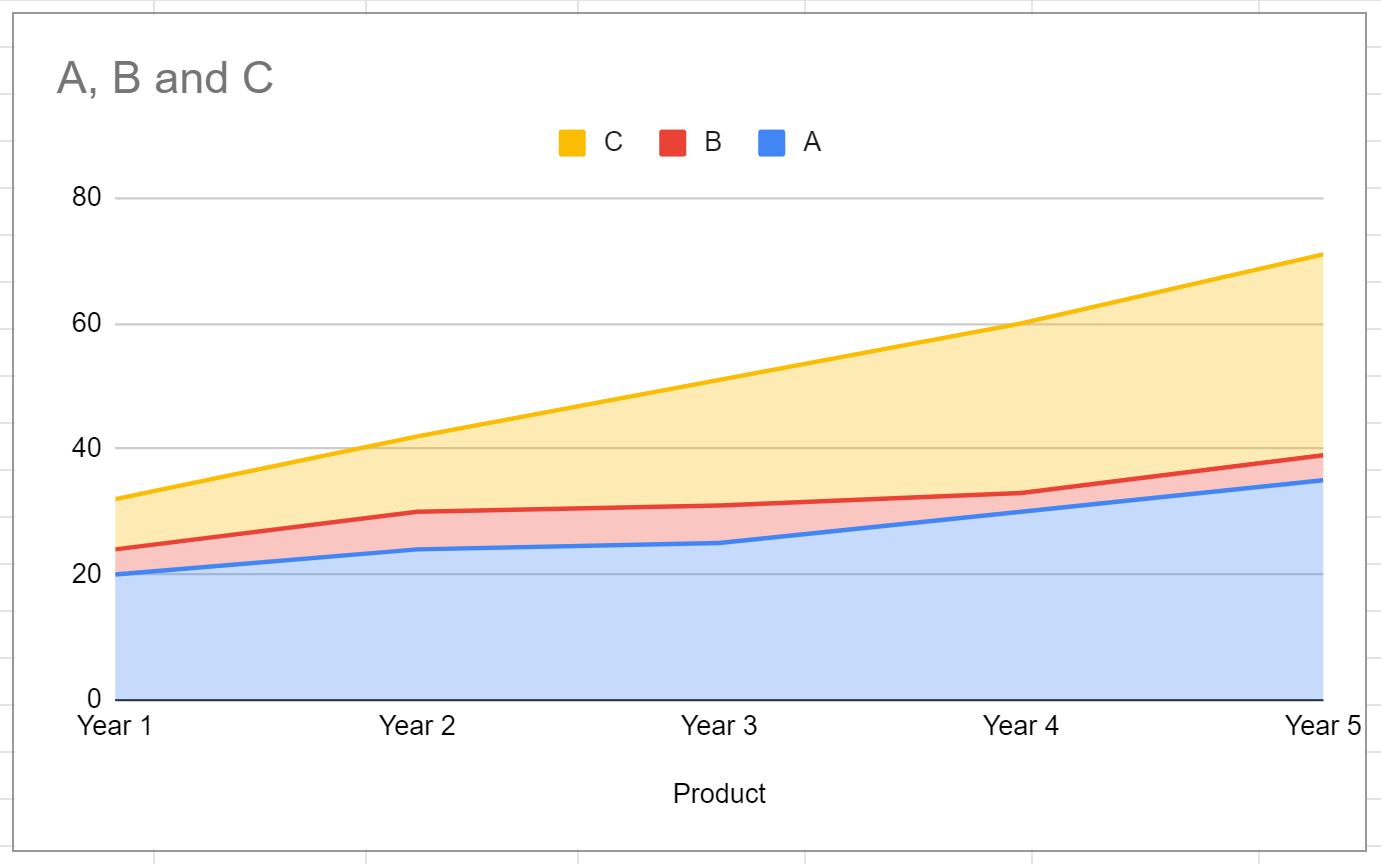
The x-axis displays the year and the y-axis displays the total sales of each of the three products.
Step 3: Modify the Area Chart
Next, we can modify the appearance of the area chart to make it easier to read.
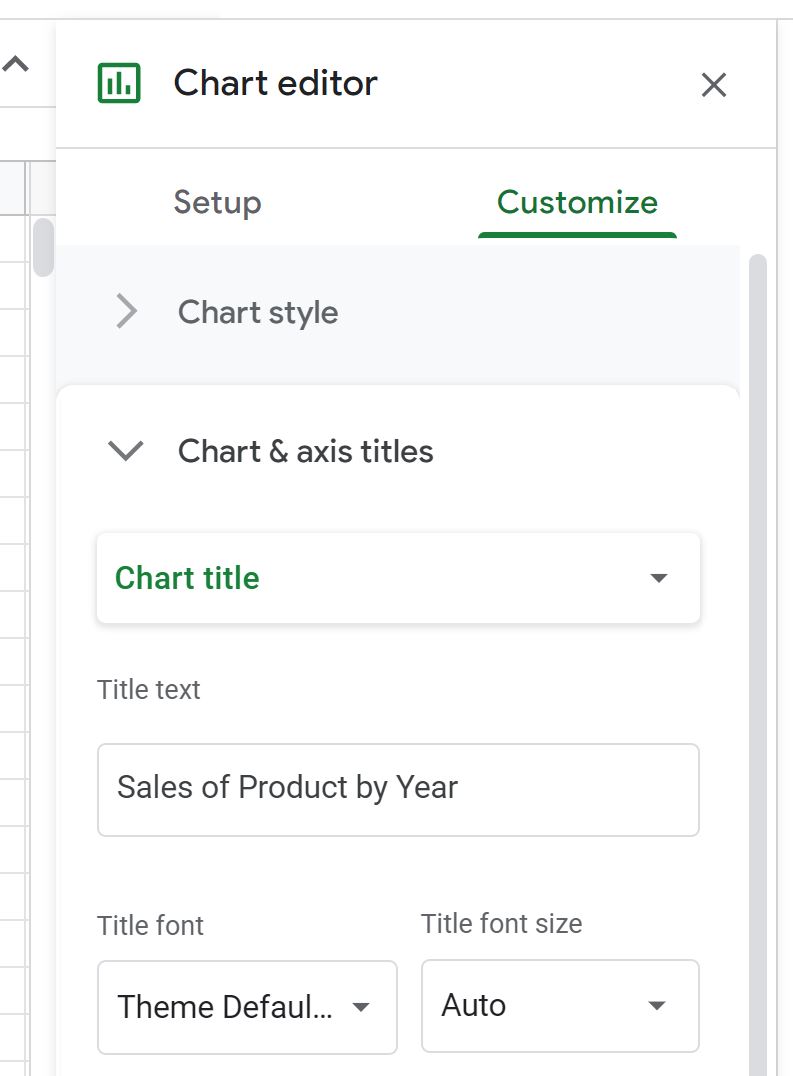
In the Chart editor panel, click the Customize tab, then click Chart & axis titles and then type in a custom title for the chart in the Title text box:
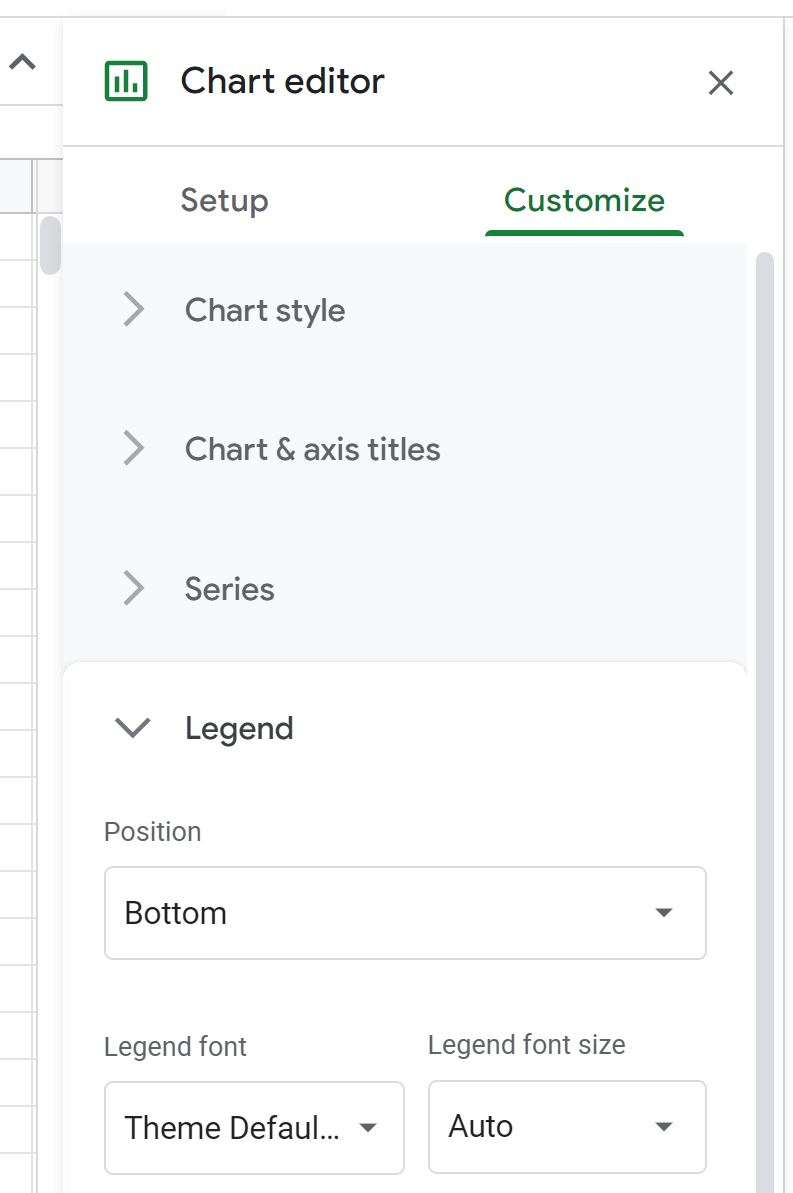
Next, click the dropdown arrow next to Legend and change the position to Bottom:
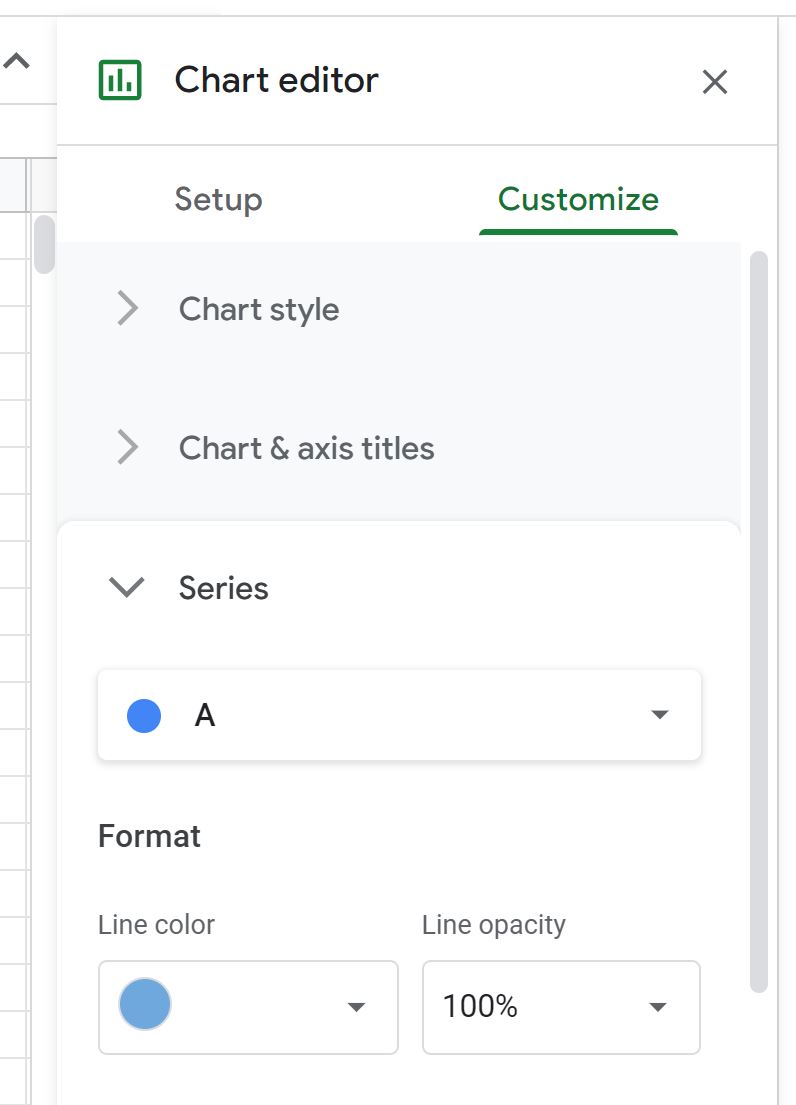
Next, click the dropdown arrow next to Series and change the color of each Series to whatever you’d like:
Here is what the final area chart will look like:
Additional Resources
The following tutorials explain how to create other common visualizations in Google Sheets:
How to Make a Box Plot in Google Sheets
How to Create a Pareto Chart in Google Sheets
How to Create a Bubble Chart in Google Sheets