You can use the alpha argument within the geom_point() function in ggplot2 to modify the transparency of the points in a plot.
This argument uses the following basic syntax:
ggplot(df, aes(x=x, y=y)) +
  geom_point(alpha=1)
The value for alpha can range between 0 and 1 where:
- 0 is completely transparent
- 1 is completely solid
The default value for alpha is 1.
By setting alpha to a value less than 1 it becomes easier to view overlapping points in a plot, which is particularly useful when plotting the points of a large dataset.
The following examples shows how to use the alpha argument in practice with the following data frame that contains 5,000 rows:
#make thise example reproducible
set.seed(1)

#create data frame with 5000 rows
df frame(x=runif(n=5000, min=1, max=100))

df$y = df$x*3 + runif(5000)*df$x^2

#view head of data frame
head(df)

         x         y
1 27.28536  108.2851
2 37.84027  622.8478
3 57.71248 1002.0662
4 90.91257 7539.2476
5 20.96651  202.6813
6 89.94058 2867.4643
Related: How to Use runif Function in R
Example 1: Using alpha = 1 in geom_point()
The following code shows how to create a scatter plot in ggplot2 by using the default value of 1 for the alpha argument:
library(ggplot2)

#create scatter plot with default alpha value
ggplot(df, aes(x=x, y=y)) +
  geom_point()

Notice that the points in the plot are completely solid, which corresponds to an alpha value of 1.
Example 2: Using alpha = 0 in geom_point()
The following code shows how to create a scatter plot in ggplot2 by using a value of 0 for the alpha argument:
library(ggplot2)

#create scatter plot with alpha value of 0
ggplot(df, aes(x=x, y=y)) +
  geom_point(alpha=0)
All of the points in the plot are completely transparent, which corresponds to an alpha value of 0.
Example 3: Using alpha = 0.1 in geom_point()
The following code shows how to create a scatter plot in ggplot2 by using a value of 0.1 for the alpha argument:
library(ggplot2)

#create scatter plot with alpha value of 0.1
ggplot(df, aes(x=x, y=y)) +
  geom_point(alpha=0.1)
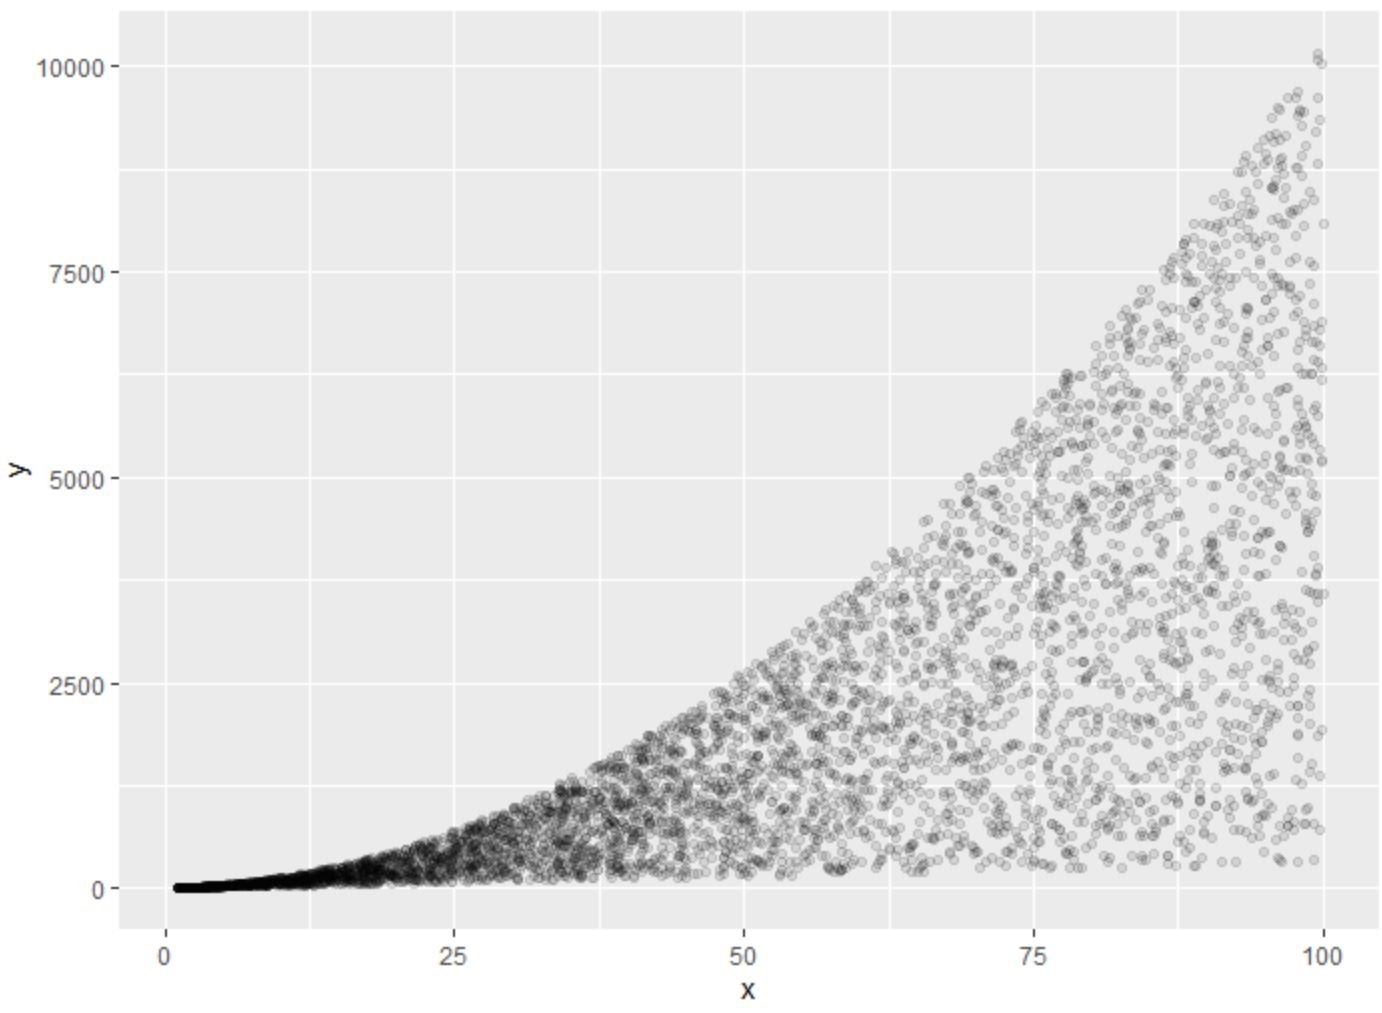
By setting alpha to 0.1, the points have a level of transparency that allows us to see where the points overlap the most on the plot.
Feel free to play around with the value of alpha within the geom_point() function to achieve a level of transparency that makes your plot the easiest to read.
Additional Resources
The following tutorials explain how to perform other common tasks in ggplot2:
How to Remove Axis Labels in ggplot2
How to Remove a Legend in ggplot2
How to Remove Gridlines in ggplot2