You can use the annotate() function to add text to plots in ggplot2.
This function uses the following basic syntax:
p +
  annotate("text", x=6, y=10, label= "hello")
where:
- x, y: The (x, y) coordinates where the text should be placed.
- label: The text to display.
The following examples show how to use this function in practice.
Example 1: Add One Text Element to ggplot2
The following code shows how to use annotate() to add one text element to a ggplot2 scatterplot:
library(ggplot2)

#create data frame
df frame(x=c(1, 3, 3, 5, 7, 8, 10, 11),
                 y=c(3, 5, 7, 5, 8, 10, 14, 19))

#create scatter plot with one text element
ggplot(df, aes(x=x, y=y)) +
  geom_point()
  annotate("text", x=6, y=10, label= "hello")
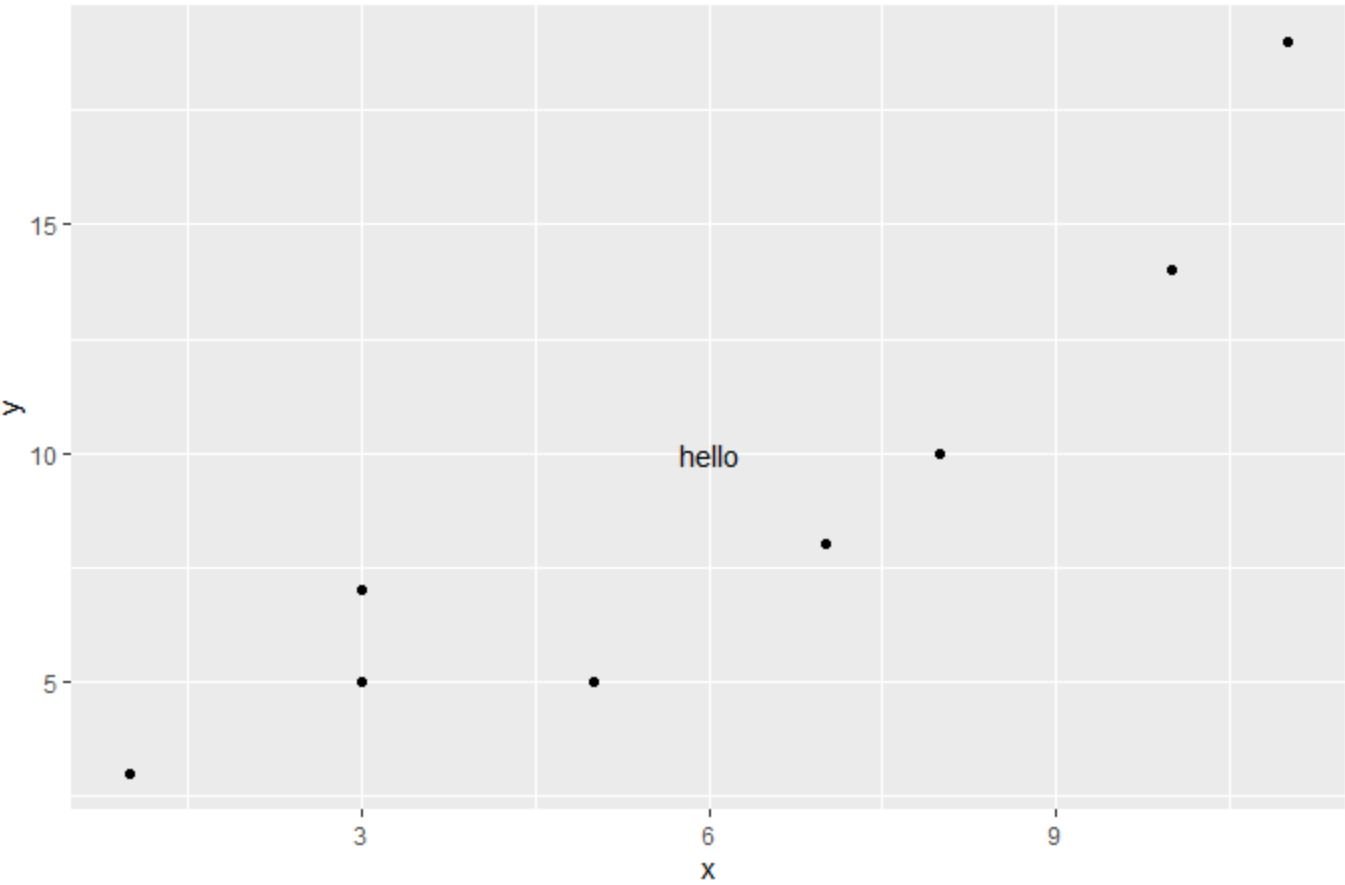
Notice that our text element has been added to the (x, y) coordinates of (6, 10) in the plot.
Example 2: Add Multiple Text Elements to ggplot2
The following code shows how to use annotate() to add multiple text elements to a ggplot2 scatterplot:
library(ggplot2)

#create data frame
df frame(x=c(1, 3, 3, 5, 7, 8, 10, 11),
                 y=c(3, 5, 7, 5, 8, 10, 14, 19))

#create scatter plot with one text element
ggplot(df, aes(x=x, y=y)) +
  geom_point() +
  annotate("text", x=6, y=10, label= "hello") +
  annotate("text", x=3, y=15, label= "hello again")
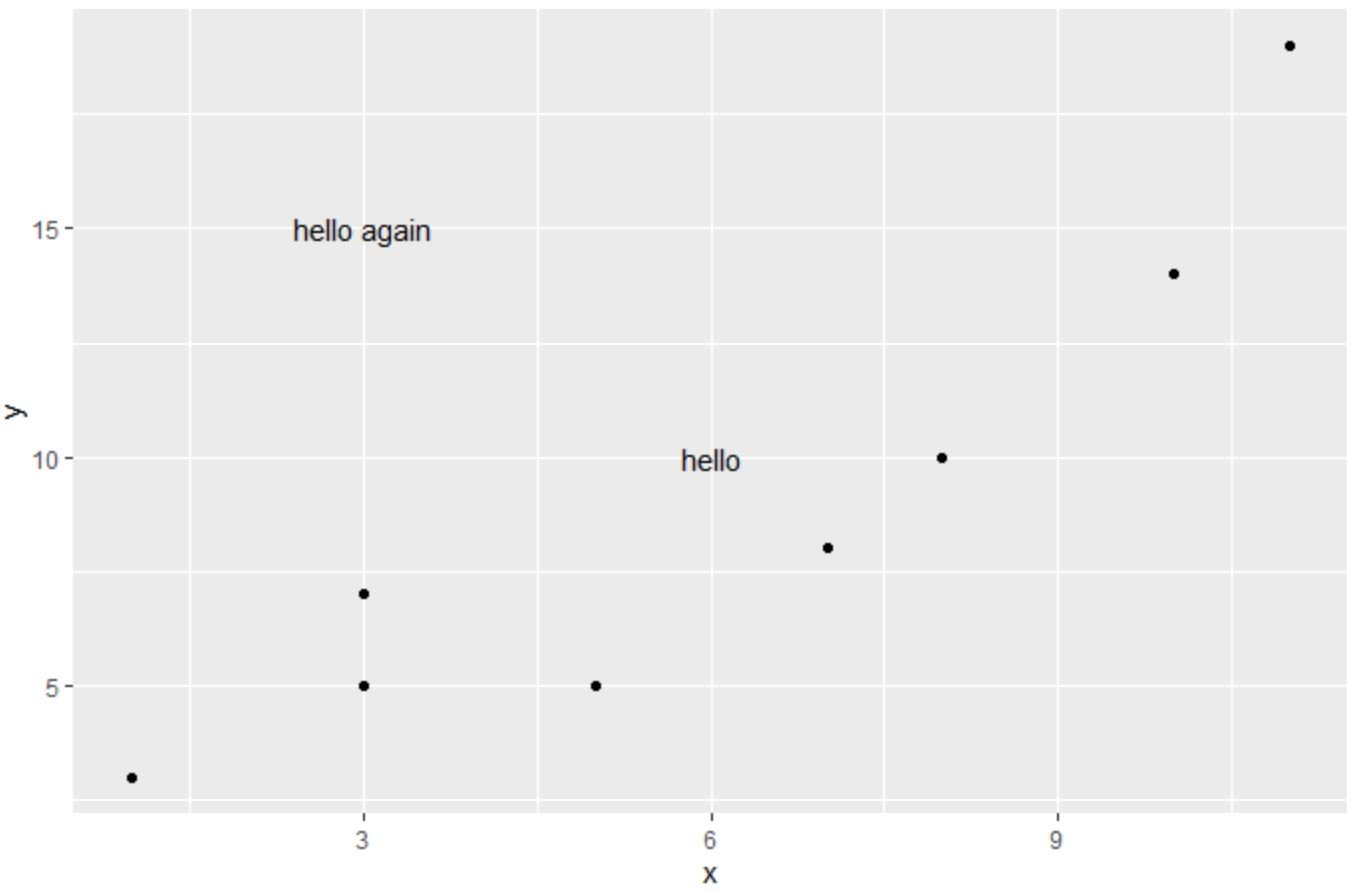
Notice that two text elements have been added to the plot at the coordinates that we specified.
Example 3: Customize Text Elements in Plot
We can use the size, col, and italic or bold arguments to customize the size, color, and font style of the text elements in the plot, respectively:
library(ggplot2)

#create data frame
df frame(x=c(1, 3, 3, 5, 7, 8, 10, 11),
                 y=c(3, 5, 7, 5, 8, 10, 14, 19))

#create scatter plot with custom text element
ggplot(df, aes(x=x, y=y)) +
  geom_point() +
  annotate("text", x=6, y=10, label= "bolditalic(hello)",
           col="blue", size=10, parse=TRUE)
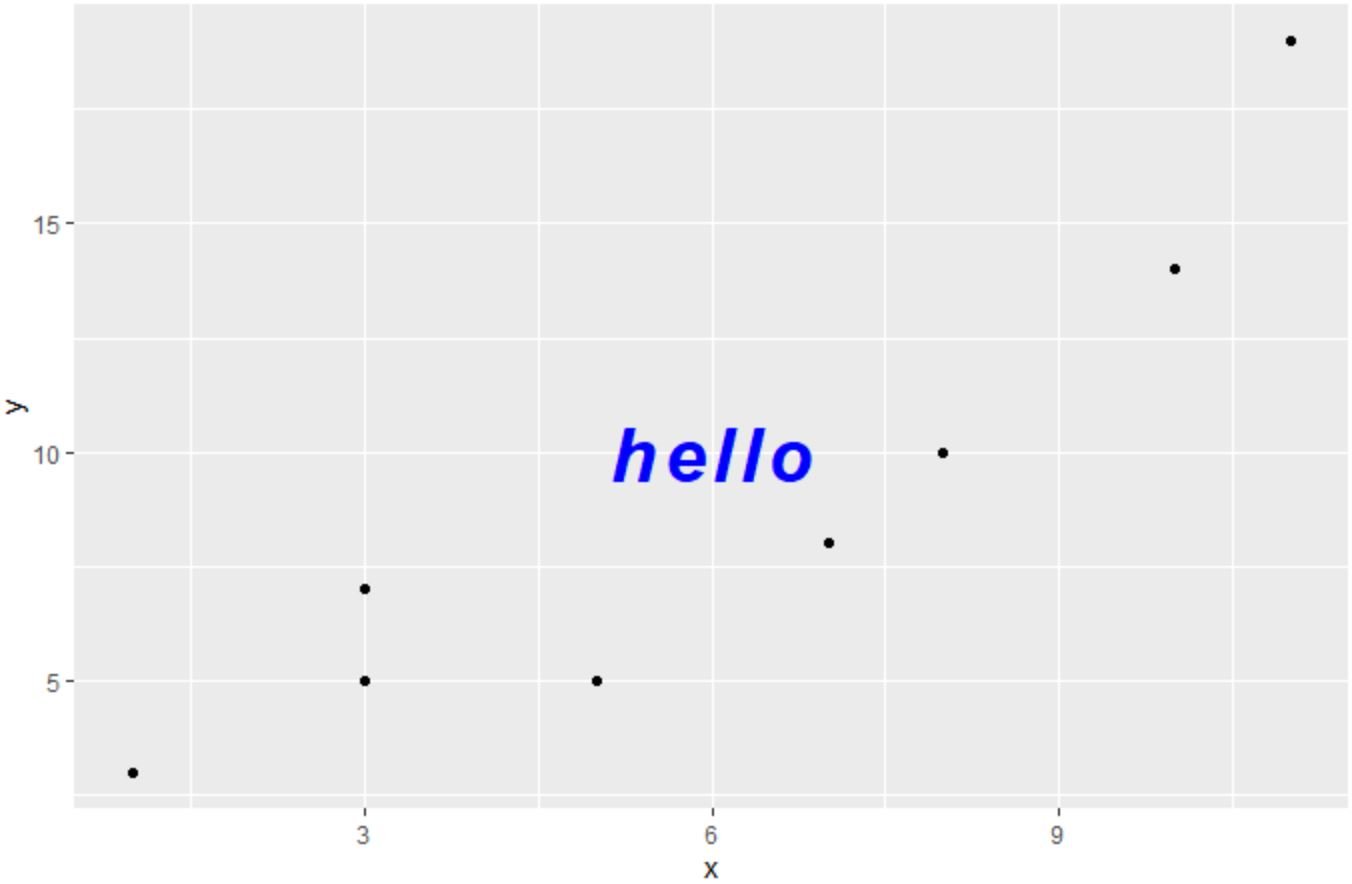
Notice that the one text element in the plot is now bold, italic, blue and has a size of 10.
Note: You can find the complete documentation for the annotate() function in ggplot2 here.
Additional Resources
The following tutorials explain how to perform other common tasks in R:
How to Change Point Size in ggplot2
How to Change Title Position in ggplot2
How to Remove Axis Labels in ggplot2