You can use the following basic syntax to create subplots in Matplotlib:
import matplotlib.pyplot as plt

#define figure
fig = plt.figure()

#add first subplot in layout that has 3 rows and 2 columns
fig.add_subplot(321)

#add fifth subplot in layout that has 3 rows and 2 columns
fig.add_subplot(325)

...
The following examples show how to use this syntax in practice.
Example 1: Add Subplots with Even Layout
The following code shows how to create six subplots in a layout that has 3 rows and 2 columns:
import matplotlib.pyplot as plt

#define figure
fig = plt.figure()

#add subplots
fig.add_subplot(321).set_title('321')
fig.add_subplot(322).set_title('322')
fig.add_subplot(323).set_title('323')
fig.add_subplot(324).set_title('324')
fig.add_subplot(325).set_title('325')
fig.add_subplot(326).set_title('326')

#display plots
plt.show()
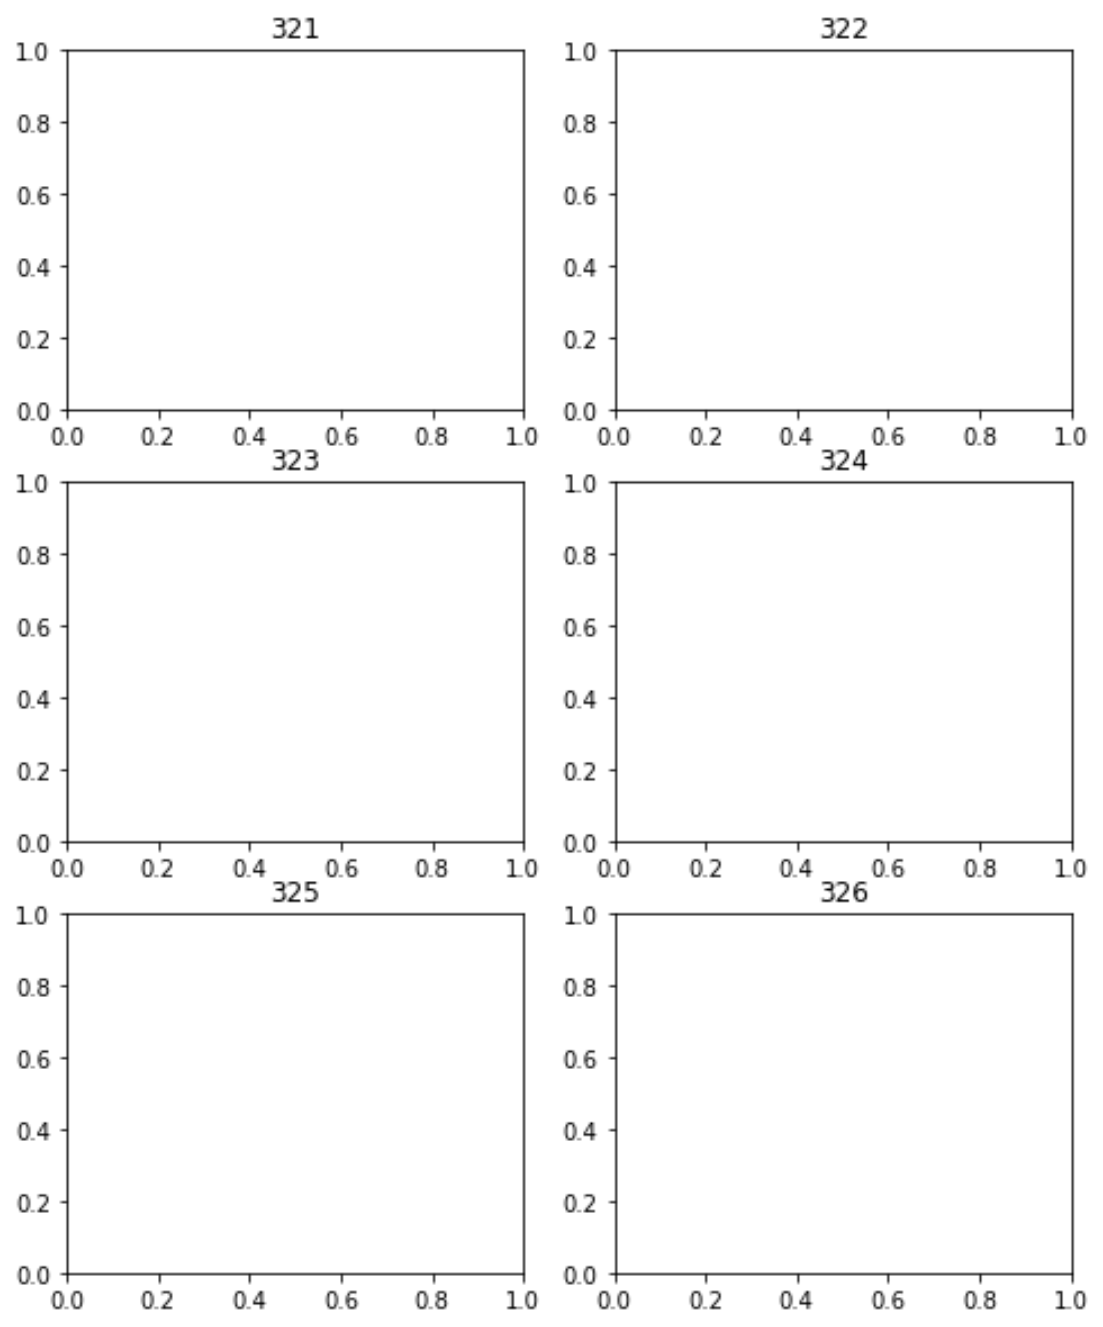
Notice that the result is six subplots displayed in a layout that has 3 rows and 2 columns.
Example 2: Add Subplots with Uneven Layout
The following code shows how to create four subplots in the following manner:
- Three of the plots are created in a grid with 3 rows and 2 columns.
- The fourth plot is created in a grid with 1 row and 2 columns.
import matplotlib.pyplot as plt

#define figure
fig = plt.figure()

#add subplots
fig.add_subplot(321).set_title('321')
fig.add_subplot(323).set_title('323')
fig.add_subplot(325).set_title('325')
fig.add_subplot(122).set_title('122')

#display plots
plt.show()
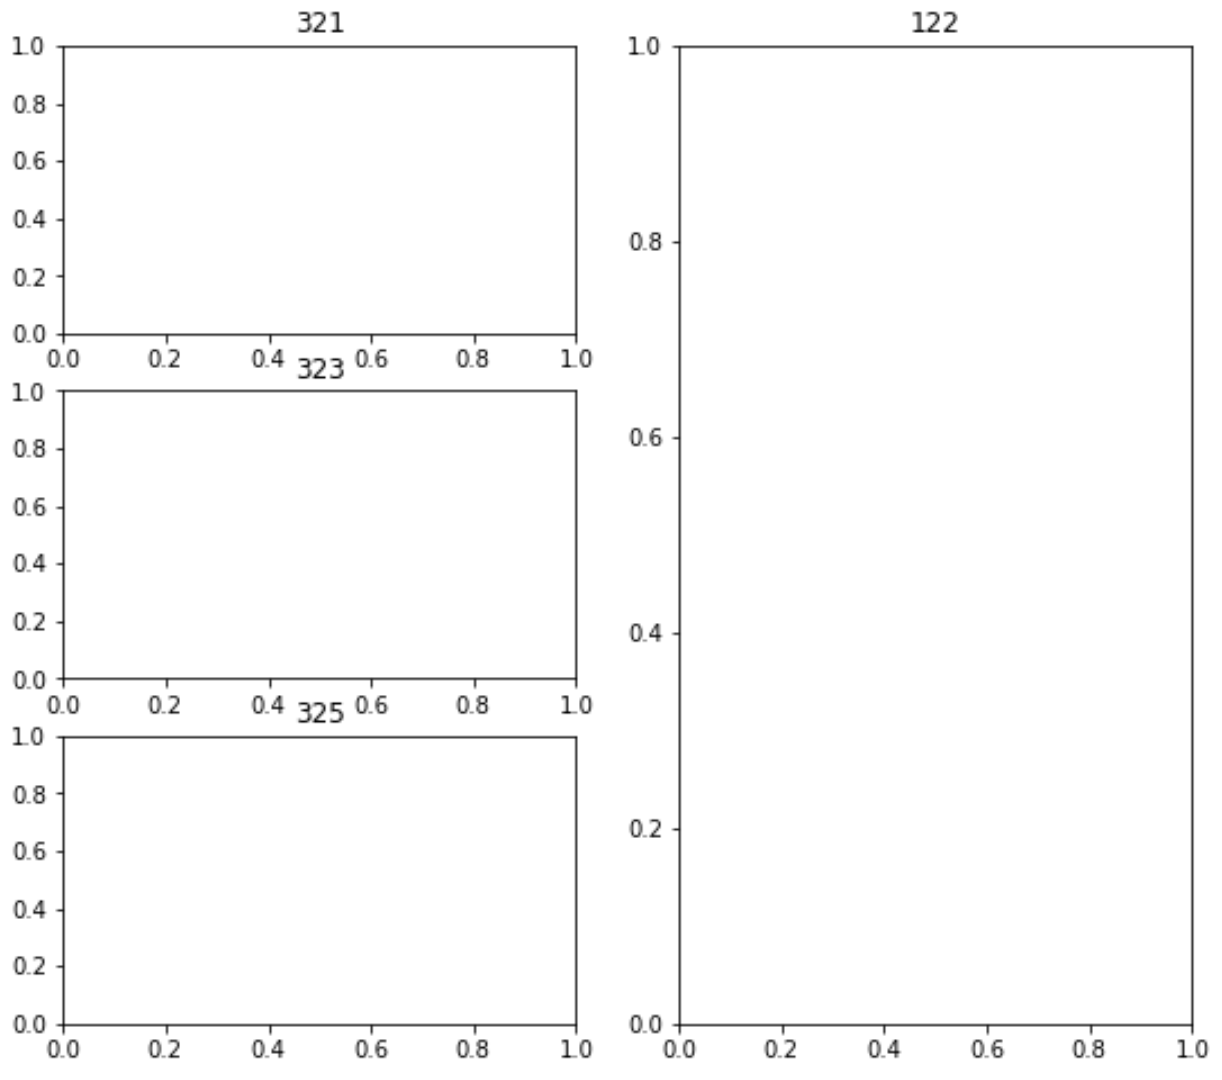
The end result is three subplots displayed in a 3×2 grid while the last subplot is displayed in a 1×2 grid.
Additional Resources
The following tutorials explain how to perform other common operations in Matplotlib:
How to Adjust Spacing Between Matplotlib Subplots
How to Adjust Subplot Size in Matplotlib
How to Add Title to Subplots in Matplotlib