You can use the following basic syntax to add a legend to a plot in pandas:
plt.legend(['A', 'B', 'C', 'D'], loc='center left', title='Legend Title')
The following example shows how to use this syntax in practice.
Example: Create and Customize Plot Legend in Pandas
Suppose we have the following pandas DataFrame:
import pandas as pd

#create DataFrame
df = pd.DataFrame({'A':7, 'B':12, 'C':15, 'D':17}, index=['Values'])
We can use the following syntax to create a bar chart to visualize the values in the DataFrame and add a legend with custom labels:
import matplotlib.pyplot as plt

#create bar chart
df.plot(kind='bar')

#add legend to bar chart
plt.legend(['A Label', 'B Label', 'C Label', 'D Label'])

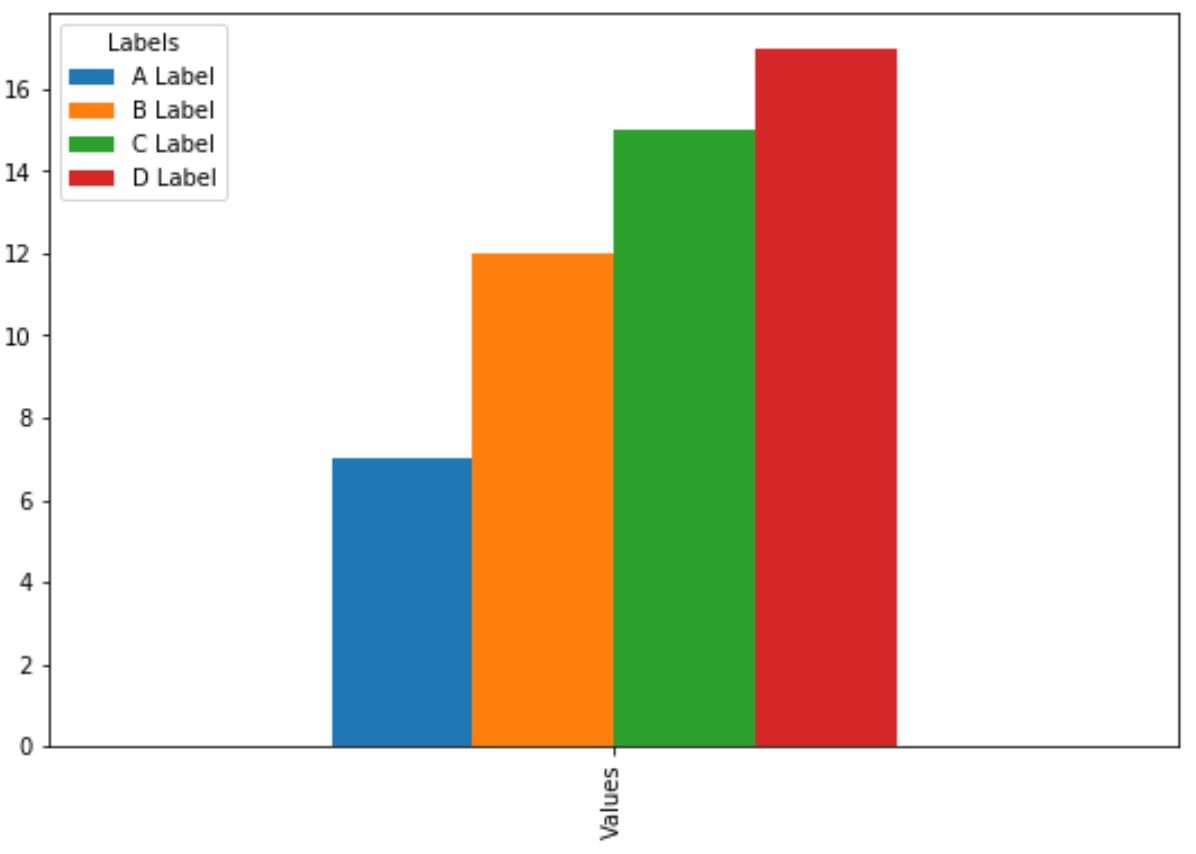
We can also use the loc argument and the title argument to modify the location and the title of the legend:
import matplotlib.pyplot as plt

#create bar chart
df.plot(kind='bar')

#add custom legend to bar chart
plt.legend(['A Label', 'B Label', 'C Label', 'D Label'],
            loc='upper left', title='Labels')
Lastly, we can use the size argument to modify the font size in the legend:
import matplotlib.pyplot as plt

#create bar chart
df.plot(kind='bar')

#add custom legend to bar chart
plt.legend(['A Label', 'B Label', 'C Label', 'D Label'], prop={'size': 20})
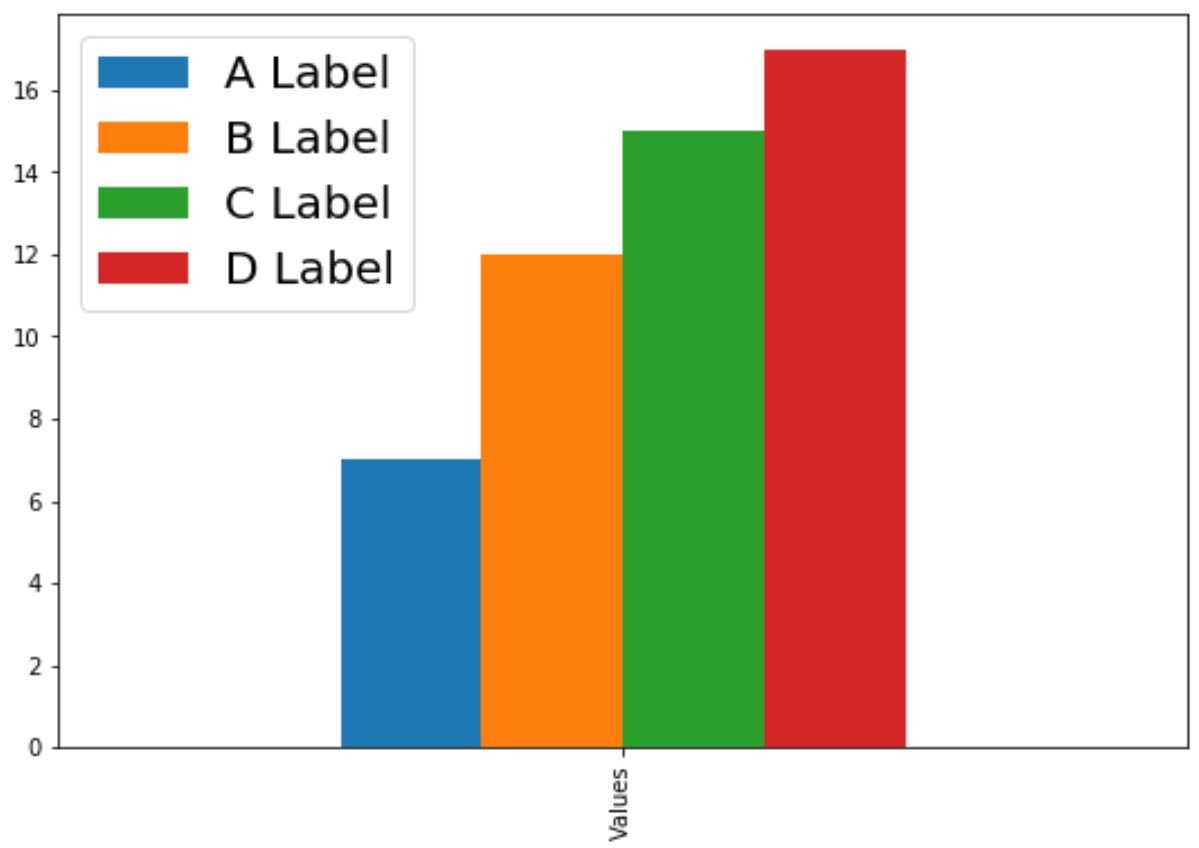
Notice that the font size in the legend is much larger now.
Additional Resources
The following tutorials explain how to perform other common operations in pandas:
How to Create a Pie Chart From Pandas DataFrame
How to Make a Scatterplot From Pandas DataFrame
How to Create a Histogram from Pandas DataFrame