One error you may encounter in R is:
Error in stripchart.default(x1, ...) : invalid plotting method
This error usually occurs when you attempt to create a scatter plot using a data frame instead of a vector.
This tutorial shares exactly how to fix this error.
How to Reproduce the Error
Suppose we have the following data frame in R:
#create data frame
df frame(x=c(1, 2, 2, 4, 7, 8, 9),
                 y=c(5, 5, 8, 10, 13, 13, 18))

#view data frame
df

  x  y
1 1  5
2 2  5
3 2  8
4 4 10
5 7 13
6 8 13
7 9 18
Now suppose we attempt to use the following syntax to create a scatter plot:
#attempt to create scatter plot
plot(df[1], df[2])

Error in stripchart.default(x1, ...) : invalid plotting method
We receive an error because both df[1] and df[2] are actually data frames and the plot() function only accepts vectors as input.
We can use the class() function to verify that df[1] and df[2] are both data frames:
#display class of df[1] and df[2]
class(df[1]);class(df[2])

[1] "data.frame"
[1] "data.frame"
How to Fix the Error
The way to fix this error is to make sure that we use vectors as inputs for the plot() function.
For example, we can use the following syntax to create a scatter plot:
#create scatter plot
plot(df[, 1], df[, 2])

Or we could use the following syntax to create a scatter plot:
#create scatter plot
plot(df$x, df$y)
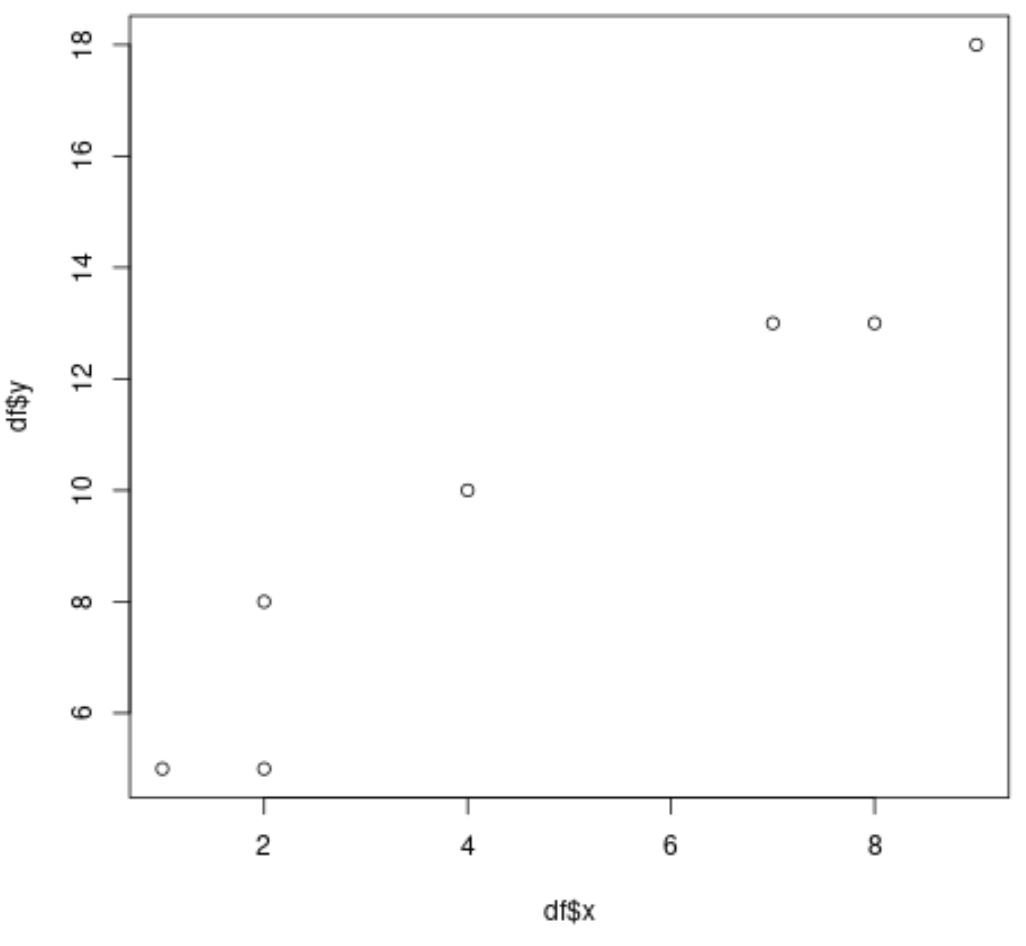
Notice that we’re able to create a scatter plot using either method without any errors because we used vectors as inputs to the plot() function each time.
Additional Resources
The following tutorials explain how to troubleshoot other common errors in R:
How to Fix in R: names do not match previous names
How to Fix in R: longer object length is not a multiple of shorter object length
How to Fix in R: contrasts can be applied only to factors with 2 or more levels