You can use the following basic syntax to add a label to a vertical line in ggplot2:
+ annotate("text", x=9, y=20, label="Here is my text", angle=90)
The following examples show how to use this syntax in practice.
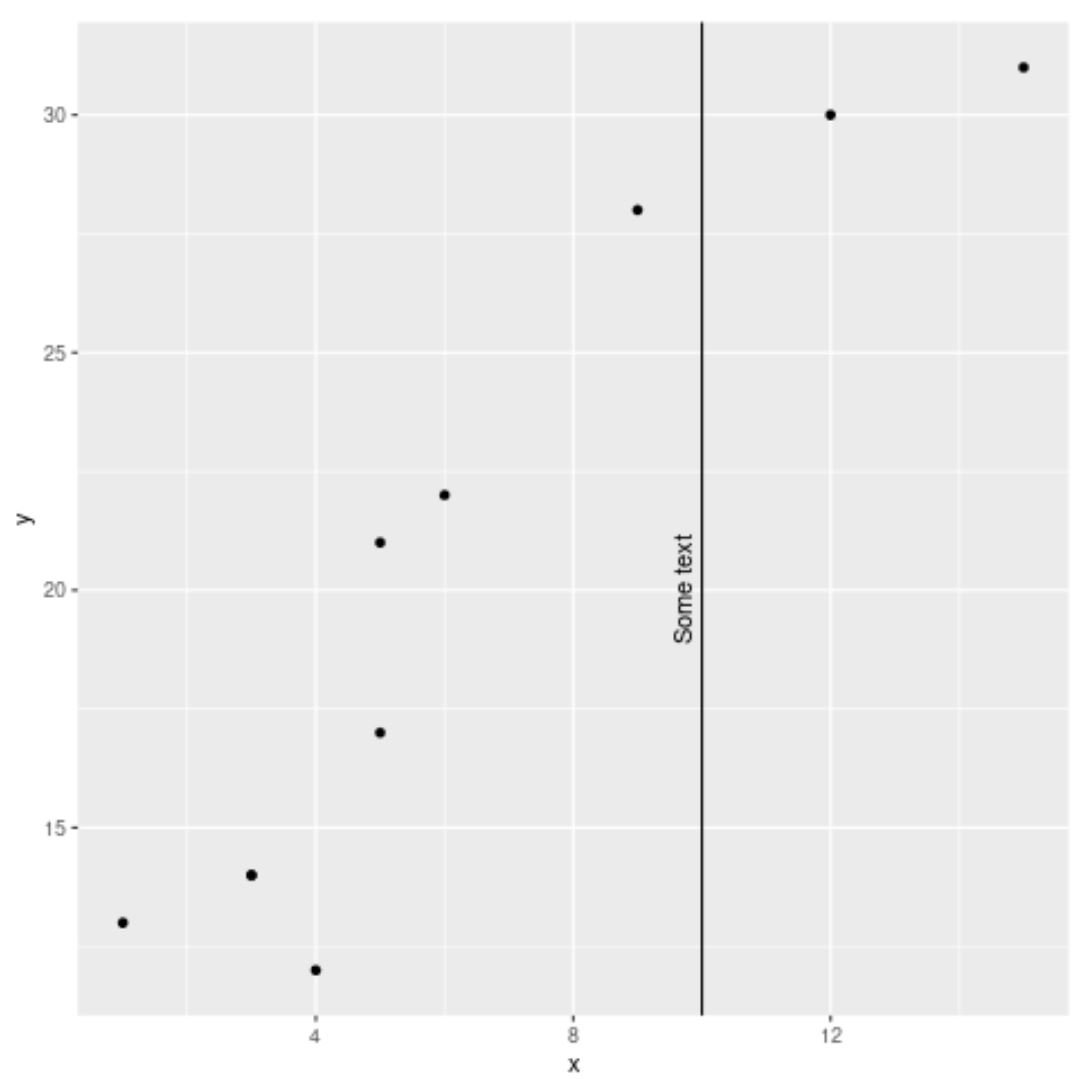
Example 1: Add Label to geom_vline
The following code shows how to add a label to a vertical line in ggplot2:
library(ggplot2)

#create data frame
df frame(x=c(1, 3, 3, 4, 5, 5, 6, 9, 12, 15),
                 y=c(13, 14, 14, 12, 17, 21, 22, 28, 30, 31))

#create scatterplot with vertical line at x=10
ggplot(df, aes(x=x, y=y)) +
  geom_point() +
  geom_vline(xintercept=10) +
  annotate("text", x=9.7, y=20, label="Some text", angle=90)
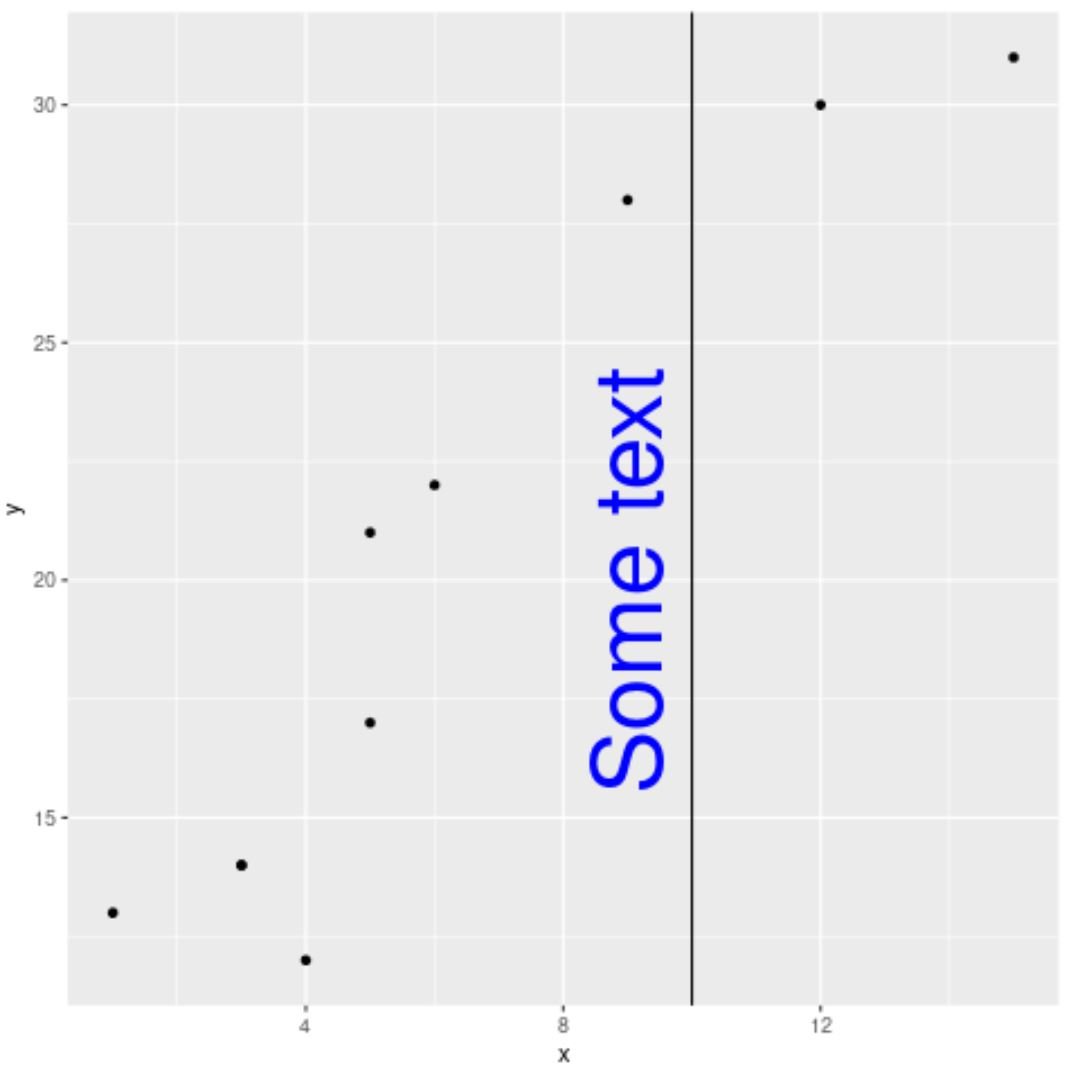
Example 2: Add Customized Label to geom_vline
The following code shows how to use the size and color arguments to add a label with a custom size and color to a vertical line in ggplot2:
library(ggplot2)

#create data frame
df frame(x=c(1, 3, 3, 4, 5, 5, 6, 9, 12, 15),
                 y=c(13, 14, 14, 12, 17, 21, 22, 28, 30, 31))

#create scatterplot with vertical line at x=10
ggplot(df, aes(x=x, y=y)) +
  geom_point() +
  geom_vline(xintercept=10) +
  annotate("text", x=9, y=20, label="Some text", angle=90, size=15, color="blue")
Example 3: Add Multiple Labels to geom_vline
The following code shows how to use the annotate() function multiple times to add multiple labels to a vertical line in ggplot2:
library(ggplot2)

#create data frame
df frame(x=c(1, 3, 3, 4, 5, 5, 6, 9, 12, 15),
                 y=c(13, 14, 14, 12, 17, 21, 22, 28, 30, 31))

#create scatterplot with vertical line at x=10
ggplot(df, aes(x=x, y=y)) +
  geom_point() +
  geom_vline(xintercept=10) +
  annotate("text", x=9, y=20, label="Some text", angle=90, size=15, color="blue") +
  annotate("text", x=11, y=20, label="More text", angle=90, size=13, color="red")
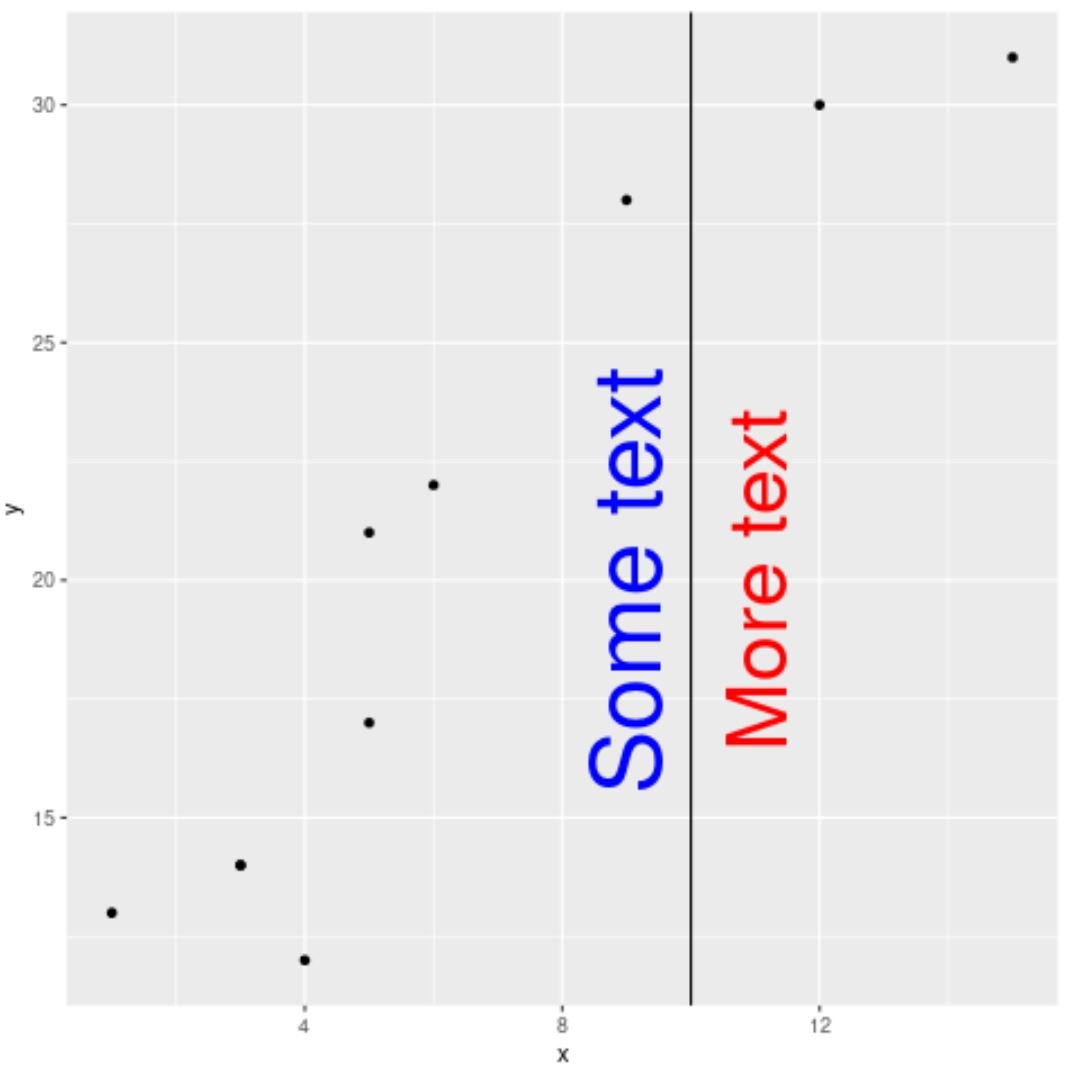
Feel free to use the annotate() function as many times as you’d like to add as many labels as you’d like to the plot.
Additional Resources
The following tutorials explain how to perform other common tasks in ggplot2:
How to Plot a Linear Regression Line in ggplot2
How to Set Axis Limits in ggplot2
How to Create Side-by-Side Plots in ggplot2