You can use the following methods to change the spacing between legend items in ggplot2:
Method 1: Change Horizontal Spacing
p +
  theme(legend.spacing.x = unit(1, 'cm'))
Method 2: Change Vertical Spacing
p +
  theme(legend.spacing.y = unit(1, 'cm')) +
  guides(fill = guide_legend(byrow = TRUE))
The following examples show how to use each method in practice with the following data frame:
#create data frame
df frame(team=c('Mavs', 'Heat', 'Nets', 'Lakers', 'Suns', 'Cavs'),
                 points=c(24, 20, 34, 39, 28, 29),
                 assists=c(5, 7, 6, 9, 12, 13))

#view data frame
df

    team points assists
1   Mavs     24       5
2   Heat     20       7
3   Nets     34       6
4 Lakers     39       9
5   Suns     28      12
6   Cavs     29      13
Example 1: Change Horizontal Spacing Between Legend Items
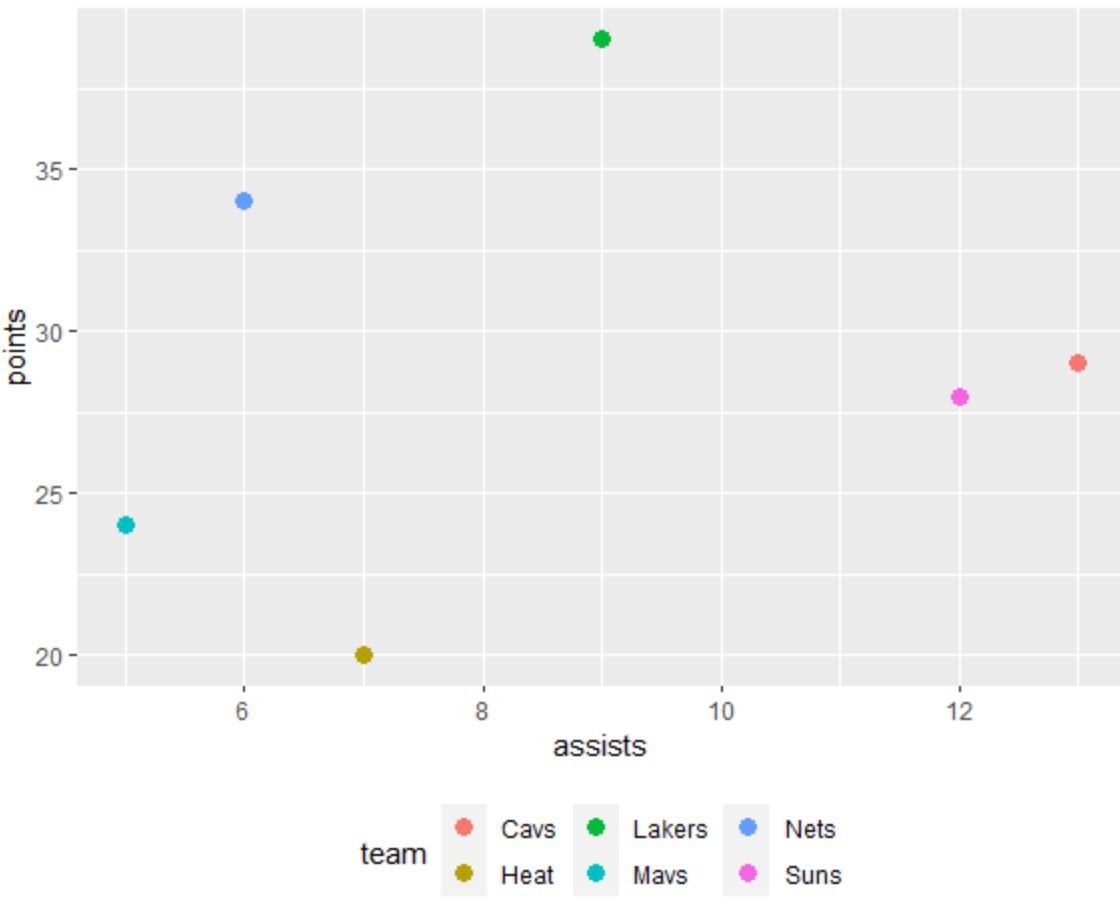
The following code shows how to create a scatter plot in ggplot2 with a horizontal legend with defaulting spacing:
library(ggplot2)

#create scatterplot with default spacing in legend
ggplot(df, aes(x=assists, y=points, color=team)) +
  geom_point(size=3) +
  theme(legend.position='bottom')
To increase the horizontal spacing between the items in the legend, we can use the legend.spacing.x argument:
library(ggplot2)

#create scatterplot with increased horizontal spacing in legend
ggplot(df, aes(x=assists, y=points, color=team)) +
  geom_point(size=3) +
  theme(legend.position='bottom',
        legend.spacing.x = unit(1, 'cm'))
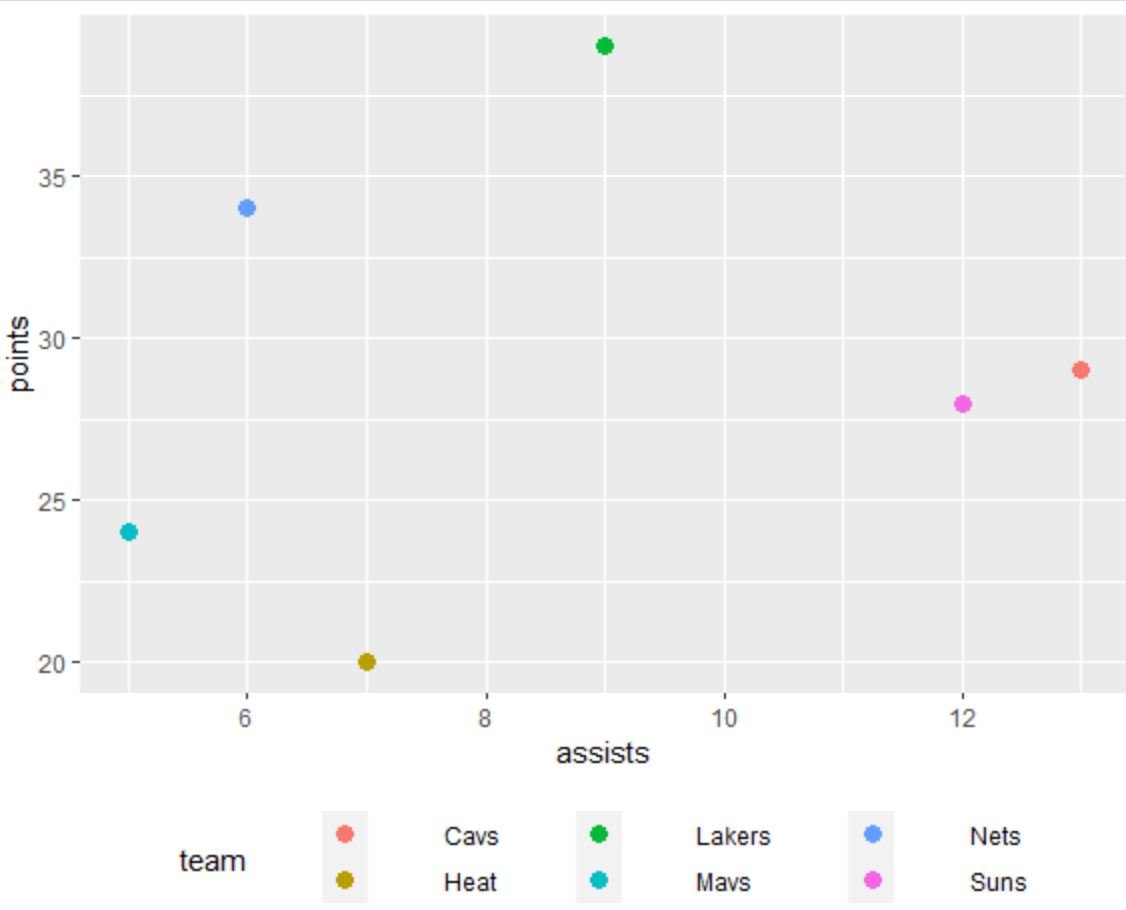
Notice that the horizontal spacing between the items in the legend has increased.
The larger the value you use in the unit() function, the greater the spacing will be between items.
Example 2: Change Vertical Spacing Between Legend Items
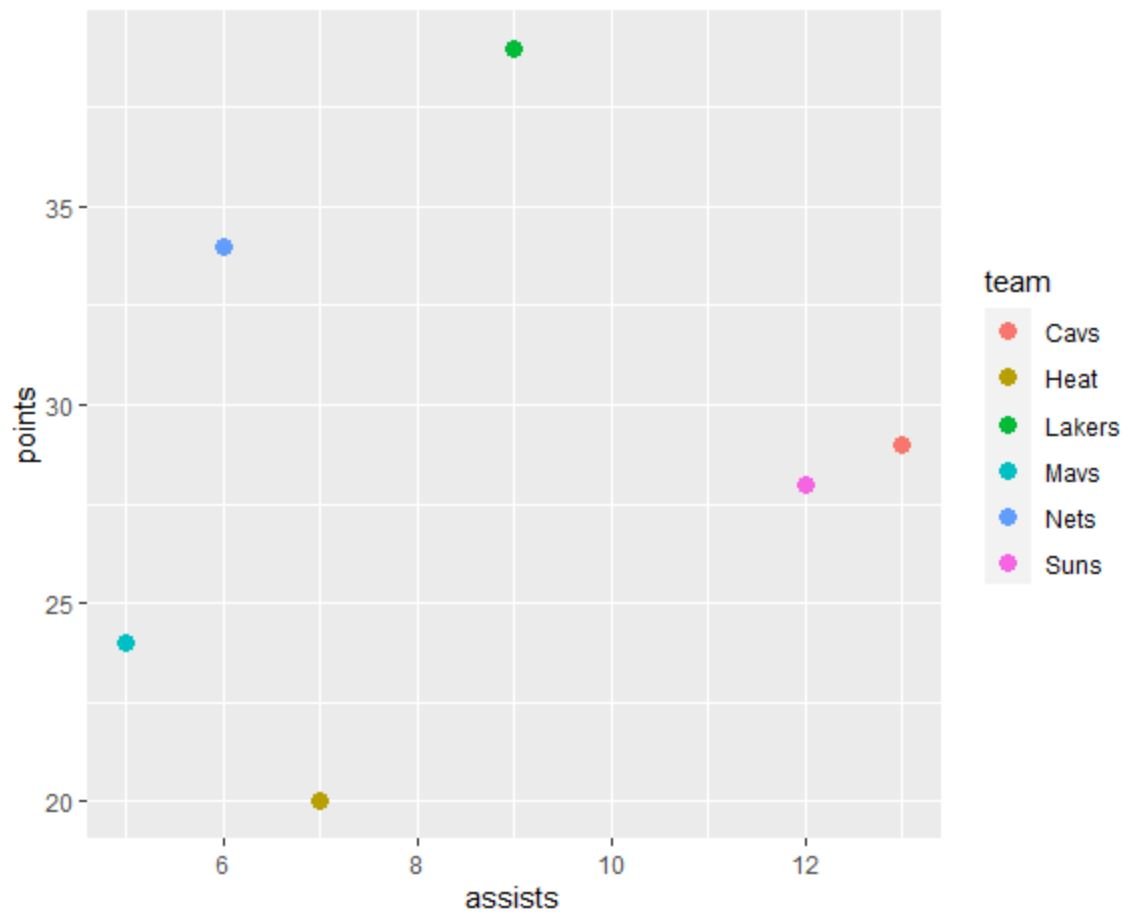
The following code shows how to create a scatter plot in ggplot2 with a vertical legend with defaulting spacing:
library(ggplot2)

#create scatterplot with default spacing in legend
ggplot(df, aes(x=assists, y=points, color=team)) +
  geom_point(size=3)
To increase the vertical spacing between the items in the legend, we can use the legend.spacing.y argument:
library(ggplot2)

#create scatterplot with increased vertical spacing in legend
ggplot(df, aes(x=assists, y=points, color=team)) +
  geom_point(size=3) +
  theme(legend.spacing.y = unit(1, 'cm')) +
  guides(fill = guide_legend(byrow = TRUE))
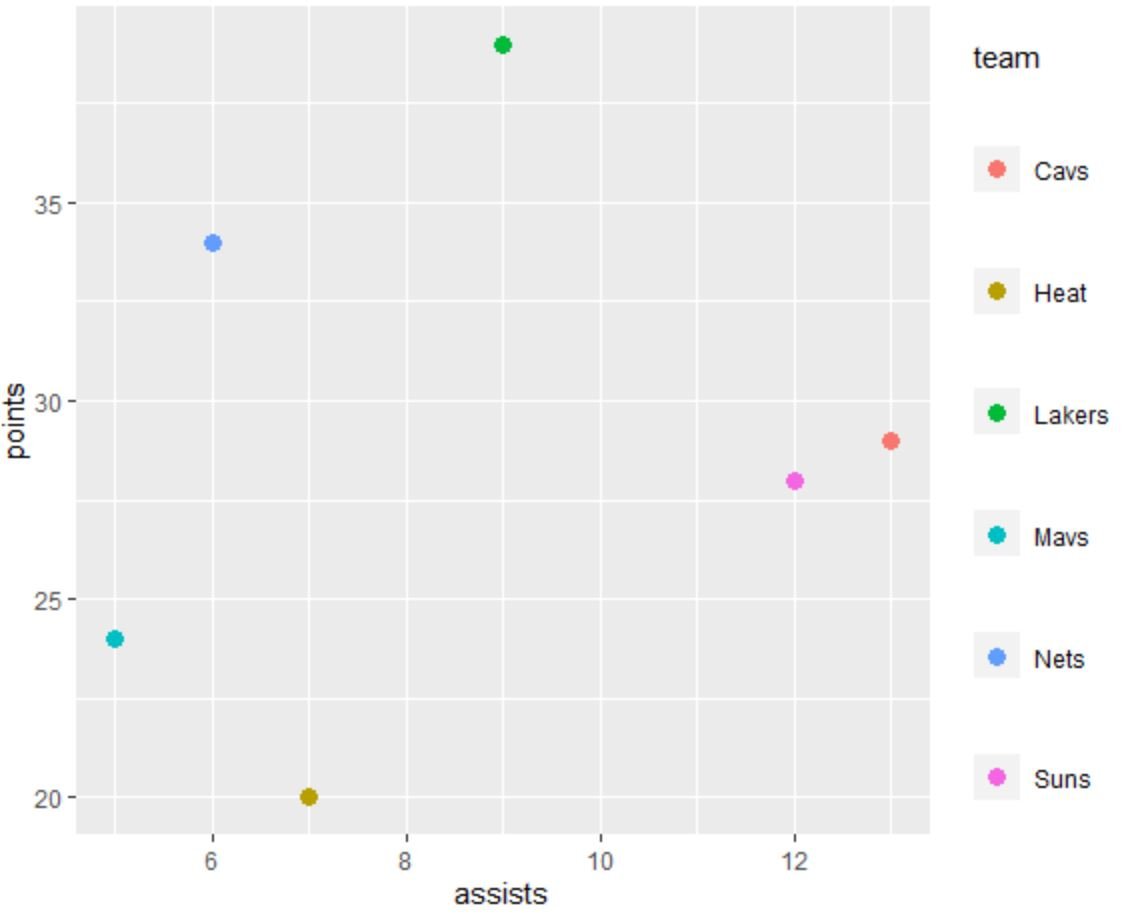
Notice that the vertical spacing between the items in the legend has increased.
The larger the value you use in the unit() function, the greater the spacing will be between items.
Note: We must include the last line that uses the byrow = TRUE argument, otherwise the items in the legend will not be spaced as expected.
Additional Resources
The following tutorials explain how to perform other common operations in ggplot2:
How to Change the Legend Title in ggplot2
How to Change Legend Size in ggplot2
How to Change Legend Position in ggplot2