You can use the following basic syntax to specify the order of facets in ggplot2:
p +
  facet_grid(~factor(my_variable, levels=c('val1', 'val2', 'val3', ...)))
The following example shows how to use this syntax in practice.
Example: Change Order of Facets in ggplot2
Suppose we have the following data frame in R:
#create data frame
df frame(team=c('A', 'A', 'B', 'B', 'C', 'C', 'D', 'D'),
                 points=c(8, 14, 20, 22, 25, 29, 30, 31),
                 assists=c(10, 5, 5, 3, 8, 6, 9, 12))

#view data frame
df

  team points assists
1    A      8      10
2    A     14       5
3    B     20       5
4    B     22       3
5    C     25       8
6    C     29       6
7    D     30       9
8    D     31      12
The following code shows how to use facet_grid() to create a grid that displays a scatterplot of assists vs. points for each team:
library(ggplot2)

#create multiple scatter plots using facet_grid
ggplot(df, aes(assists, points)) +
  geom_point() +
  facet_grid(.~team)
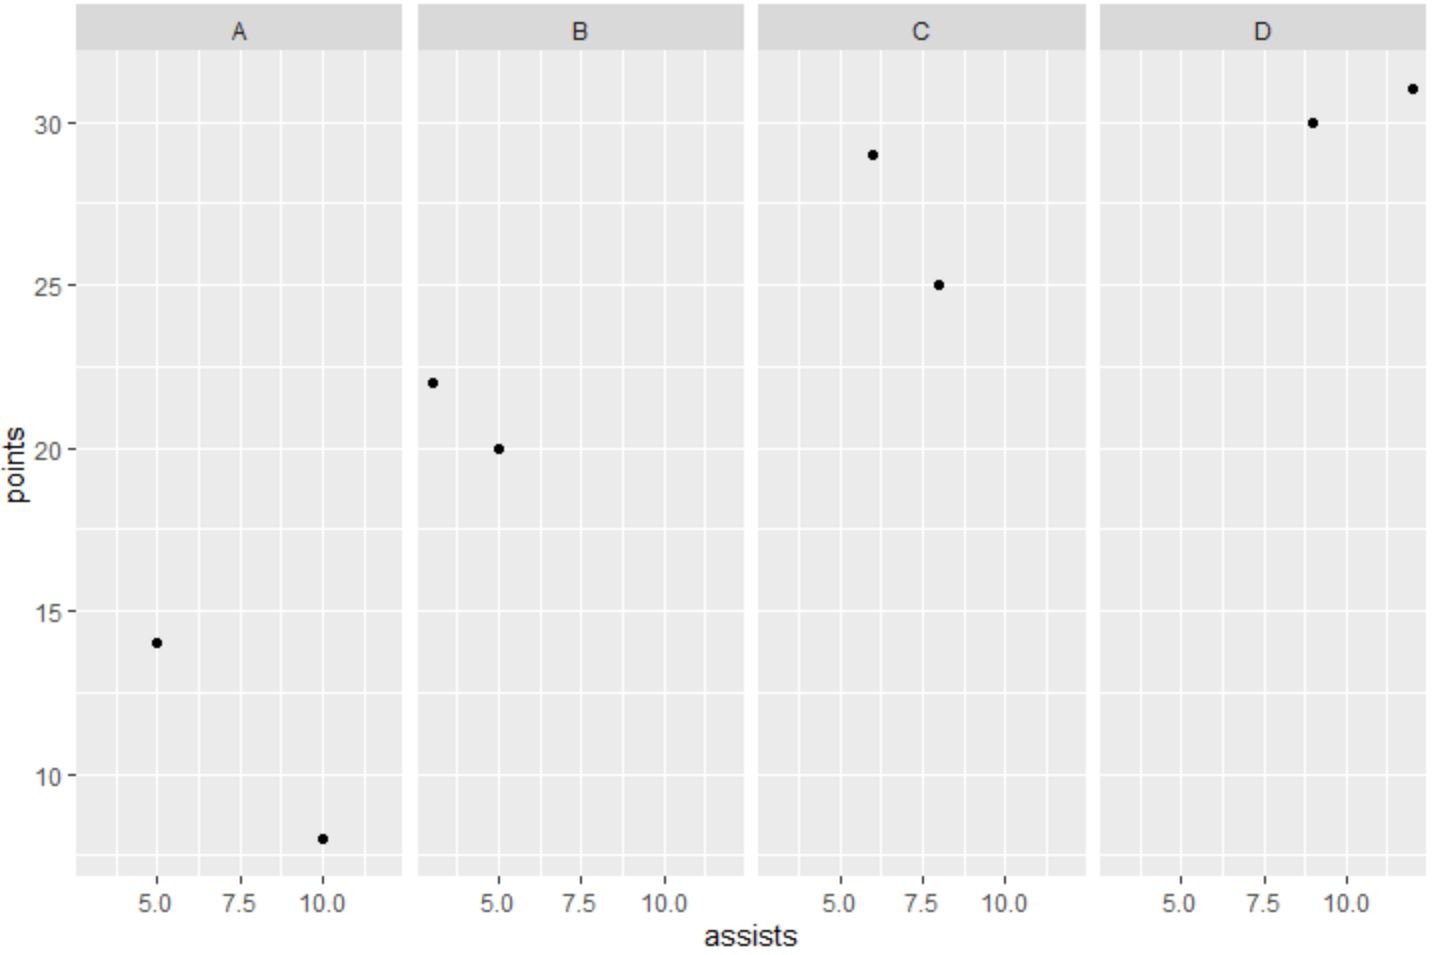
By default, ggplot2 places the scatter plots in order based on which values appear first in the team variable in the data frame.
However, we can convert team to a factor variable and use the levels argument to specify the order that the teams should be placed in the plot:
library(ggplot2)

#create multiple scatter plots using facet_grid with specific order
ggplot(df, aes(assists, points)) +
  geom_point() +
  facet_grid(~factor(team, levels=c('C', 'D', 'A', 'B')))
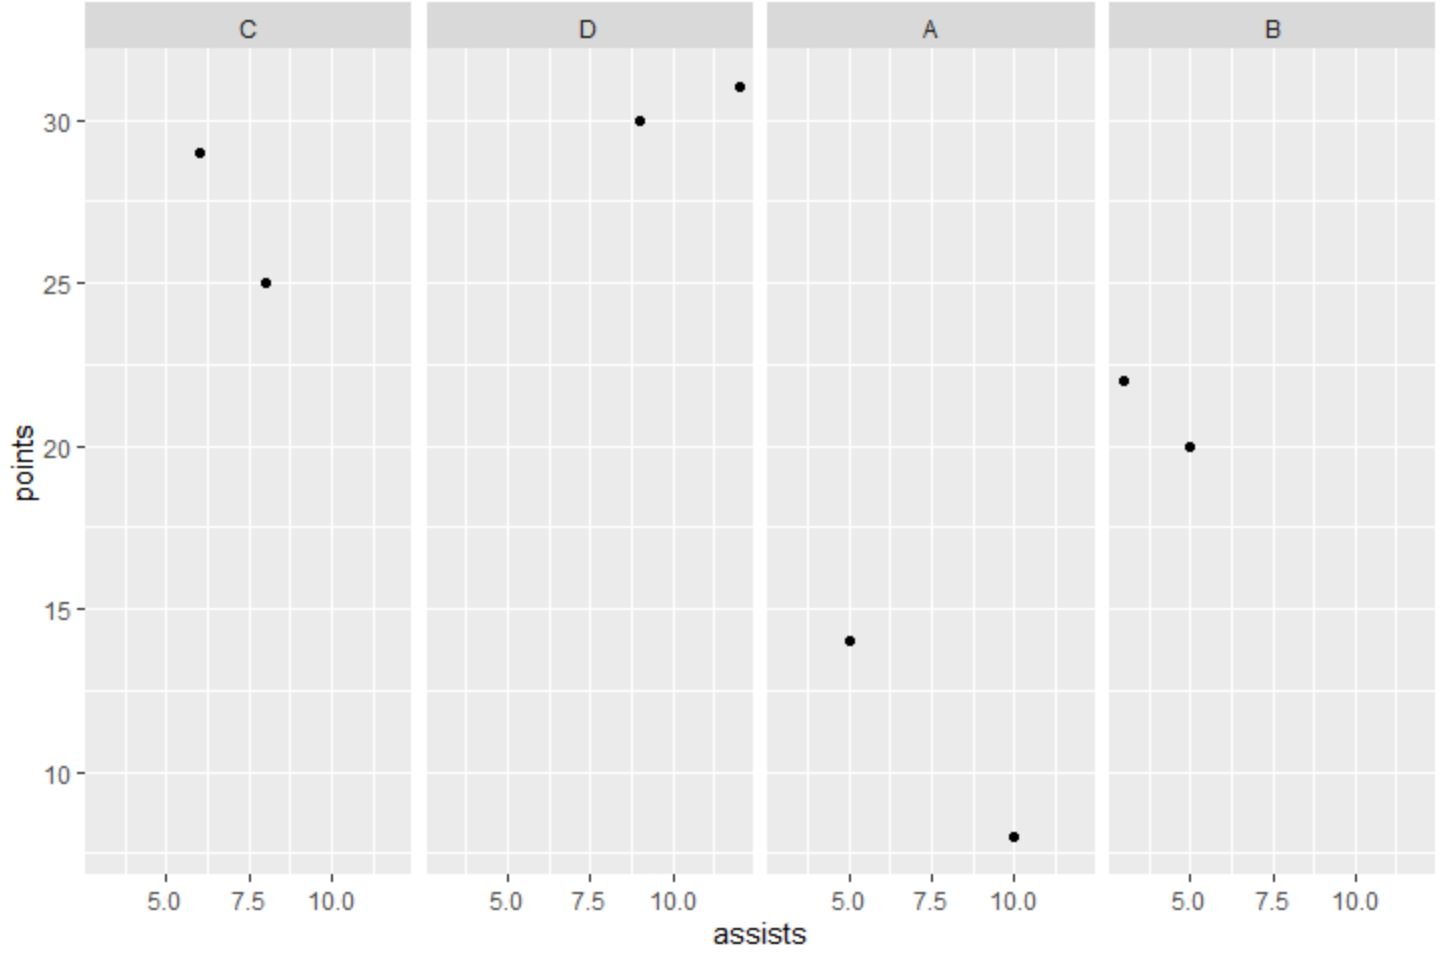
Notice that the scatter plots are now in order based on the order we specified within the levels argument: C, D, A, B.
The advantage of using this approach is that we don’t actually modify the underlying data.
Instead, we only change the levels within the facet_grid() function.
Additional Resources
The following tutorials explain how to perform other common tasks in ggplot2:
How to Change Font Size in ggplot2
How to Remove a Legend in ggplot2
How to Rotate Axis Labels in ggplot2