You can use the scale_y_reverse() and scale_x_reverse() functions to quickly reverse the order of an axis in ggplot2.
These functions use the following basic syntax:
ggplot(df, aes(x, y)) +
  geom_point() +
  scale_y_reverse()
You can also use the limits argument with these functions to specify new axis limits after reversing the axis:
ggplot(df, aes(x, y)) +
  geom_point() +
  scale_y_reverse(limits=c(100, 50))
The following example shows how to use these functions in practice.
Example: Reverse Order of Axis in ggplot2
The following code shows how to create a scatterplot in ggplot2 with a normal axis:
library(ggplot2)

#create data frame
df frame(hours=c(1, 2, 2, 3, 4, 6, 7, 7, 8, 9),
                 score=c(76, 77, 75, 79, 84, 88, 85, 94, 95, 90))

#create scatter plot with normal y-axis
ggplot(df, aes(x=hours, y=score)) +
  geom_point(size=2)
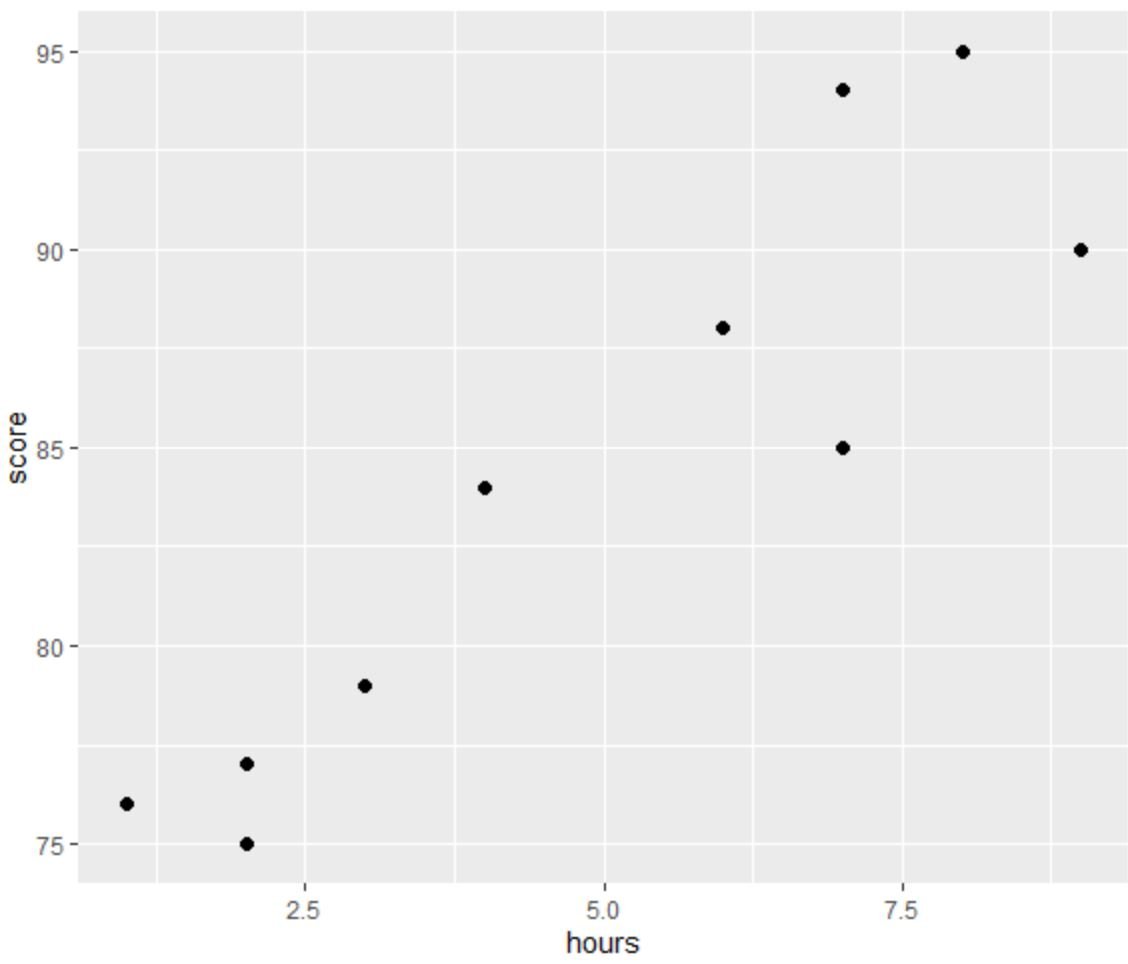
Notice that the y-axis currently ranges from 75 to 95.
The following code shows how to use the scale_y_reverse() function to reverse the order of values on the y-axis:
library(ggplot2)

#create data frame
df frame(hours=c(1, 2, 2, 3, 4, 6, 7, 7, 8, 9),
                 score=c(76, 77, 75, 79, 84, 88, 85, 94, 95, 90))

#create scatter plot with reversed y-axis
ggplot(df, aes(x=hours, y=score)) +
  geom_point(size=2) +
  scale_y_reverse()
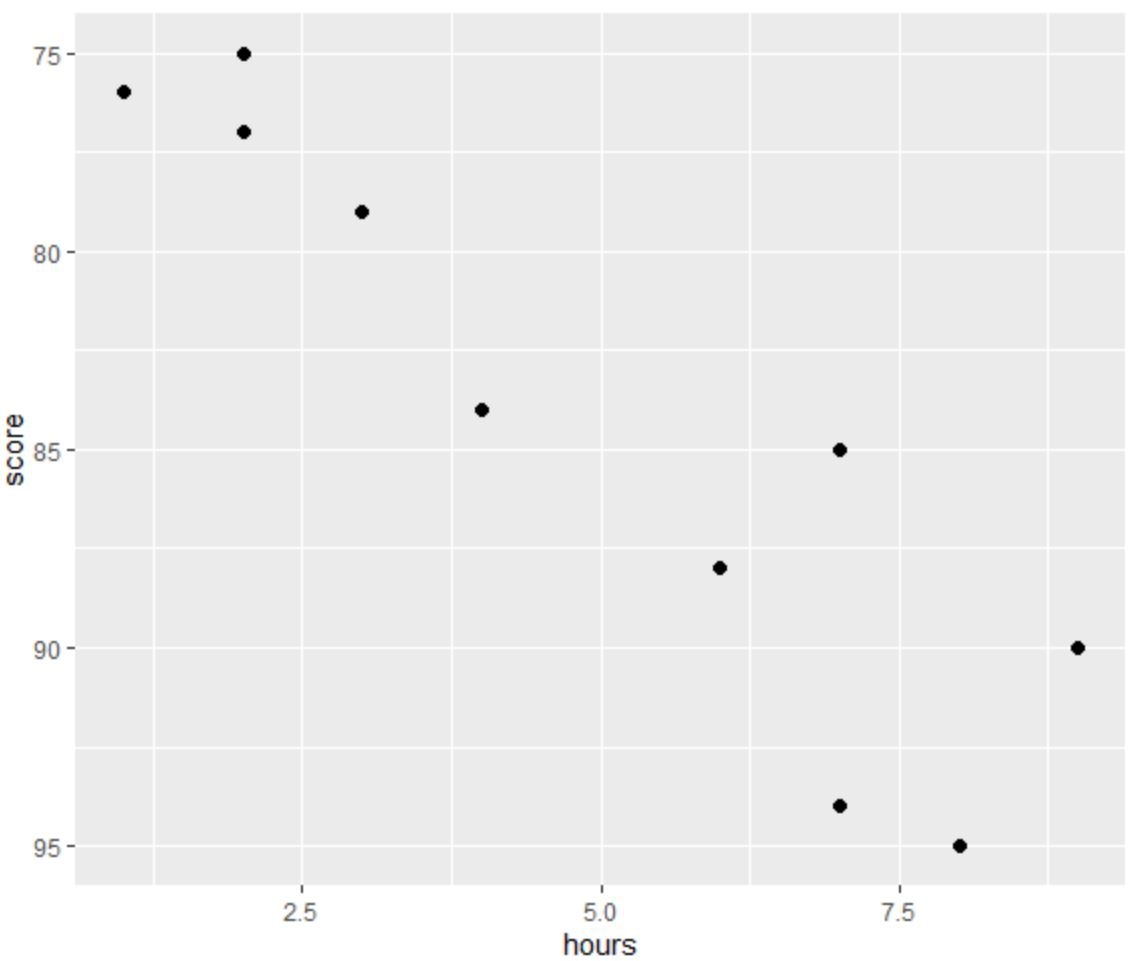
Notice that the y-axis now ranges from 95 to 75.
We could also use the limits argument within the scale_y_reverse() function to modify the y-axis limits:
library(ggplot2)

#create data frame
df frame(hours=c(1, 2, 2, 3, 4, 6, 7, 7, 8, 9),
                 score=c(76, 77, 75, 79, 84, 88, 85, 94, 95, 90))

#create scatter plot with reversed y-axis and modified limits
ggplot(df, aes(x=hours, y=score)) +
  geom_point(size=2) +
  scale_y_reverse(limits=c(100, 50))
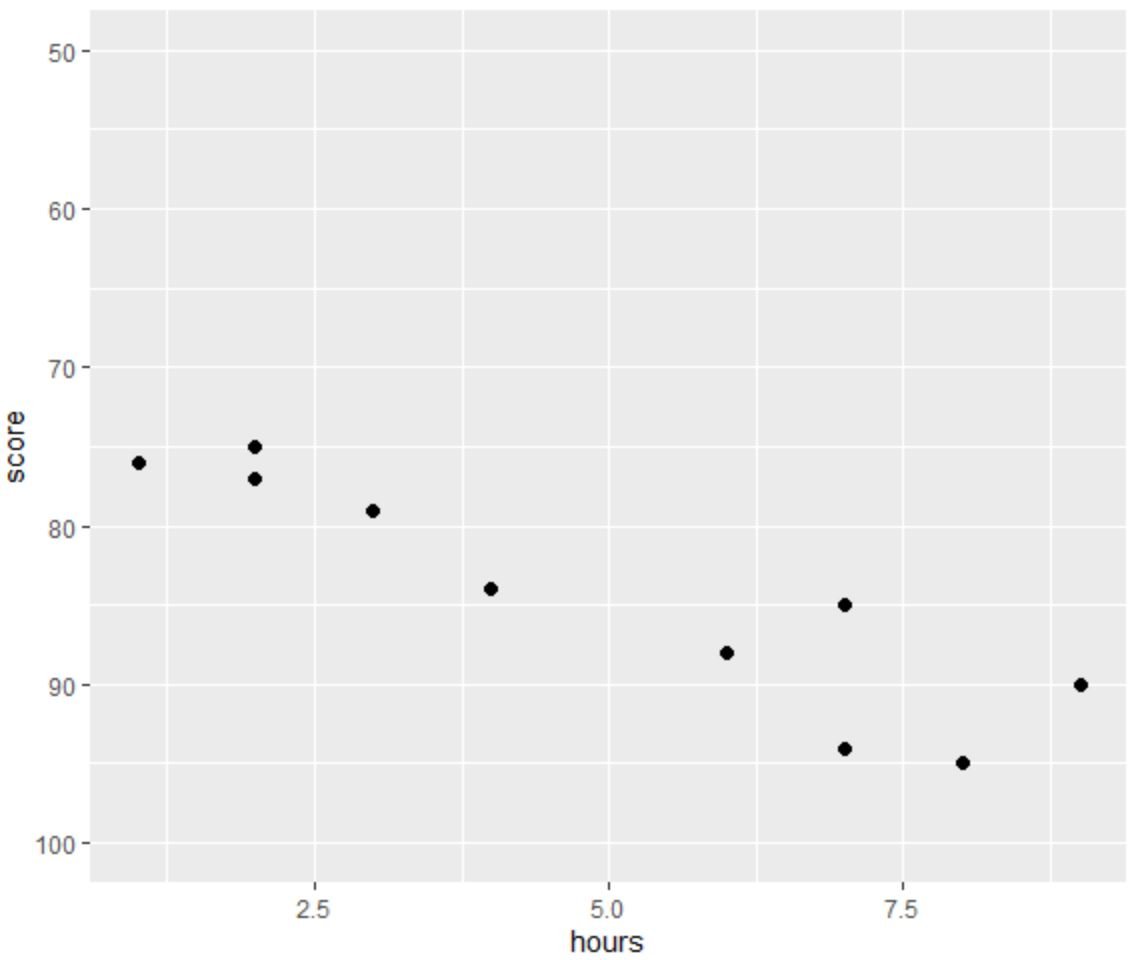
Notice that the y-axis now ranges from 100 to 50.
Additional Resources
The following tutorials explain how to perform other common tasks in ggplot2:
How to Rotate Axis Labels in ggplot2
How to Set Axis Breaks in ggplot2
How to Set Axis Limits in ggplot2
How to Change Legend Labels in ggplot2