You can use the following methods to add a subtitle to plots in ggplot2:
Method 1: Add Subtitle
p +
  labs(title='My Title', subtitle='My Subtitle')
Method 2: Add Multi-line Subtitle
p +
  labs(title='My Title', subtitle='My Subtitle Line1nLine2nLine3')
Method 3: Add Subtitle with Custom Font
p +
  labs(title='My Title', subtitle='My Subtitle Line1nLine2nLine3') +
  theme(plot.subtitle=element_text(size=18, face='italic', color='red'))
The following examples show how to use each method in practice with the following data frame in R:
#create data frame
df frame(hours=c(1, 2, 2, 3, 4, 6, 7, 7, 8, 9),
                 score=c(76, 77, 75, 79, 84, 88, 85, 94, 95, 90))

#view data frame
df

   hours score
1      1    76
2      2    77
3      2    75
4      3    79
5      4    84
6      6    88
7      7    85
8      7    94
9      8    95
10     9    90
Example 1: Add Subtitle in ggplot2
The following code shows how to add a one-line subtitle to a scatterplot in ggplot2:
library(ggplot2)

#create scatter plot with subtitle on one line
ggplot(df, aes(x=hours, y=score)) +
  geom_point(size=2) +
  labs(title='Hours Studied vs. Exam Score',
       subtitle='Data Collected in 2022')
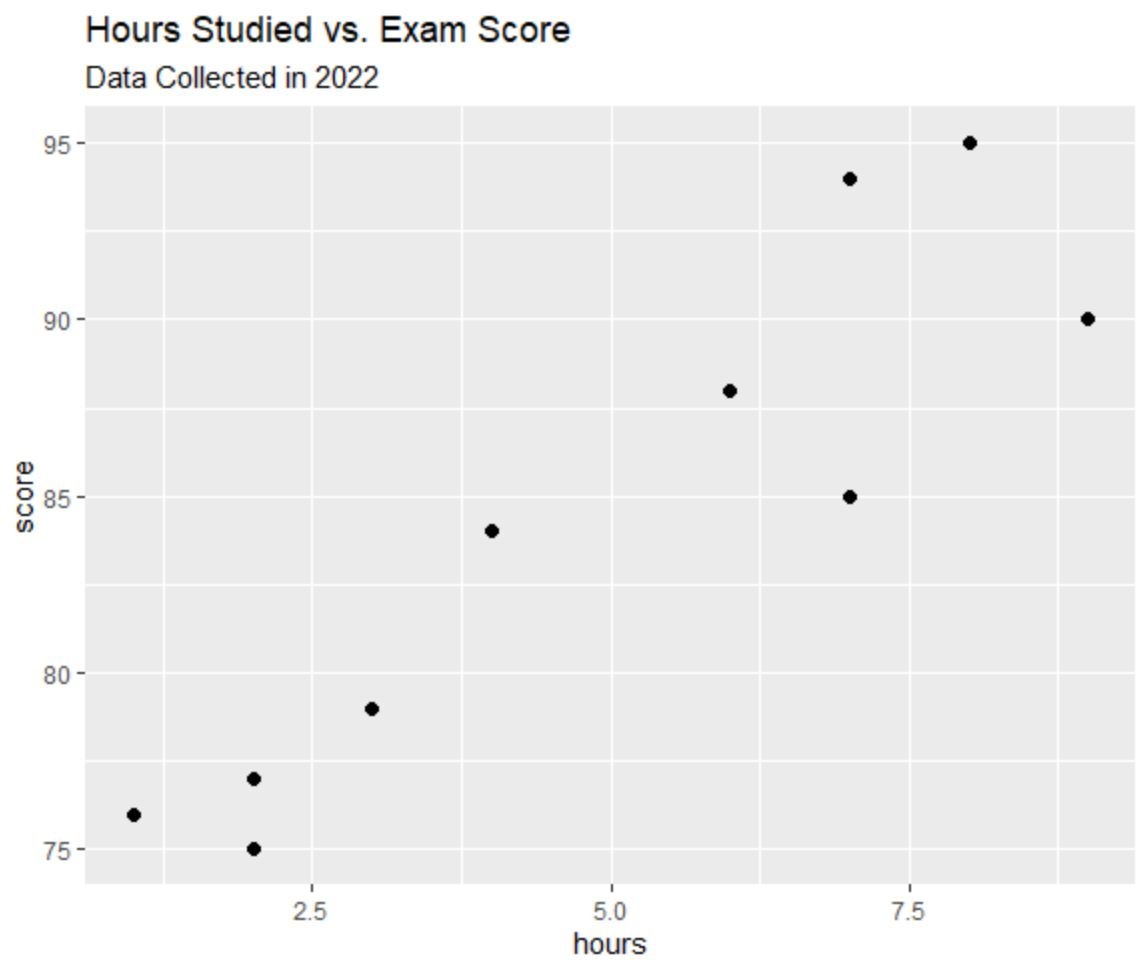
Notice that a one-line subtitle has been added directly below the plot title.
Example 2: Add Multi-Line Subtitle in ggplot2
The following code shows how to add a multi-line subtitle to a scatterplot in ggplot2:
library(ggplot2)

#create scatter plot with subtitle on multiple lines
ggplot(df, aes(x=hours, y=score)) +
  geom_point(size=2) +
  labs(title='Hours Studied vs. Exam Score',
       subtitle='Data Collected in 2022nUniversity A Exam Scores')
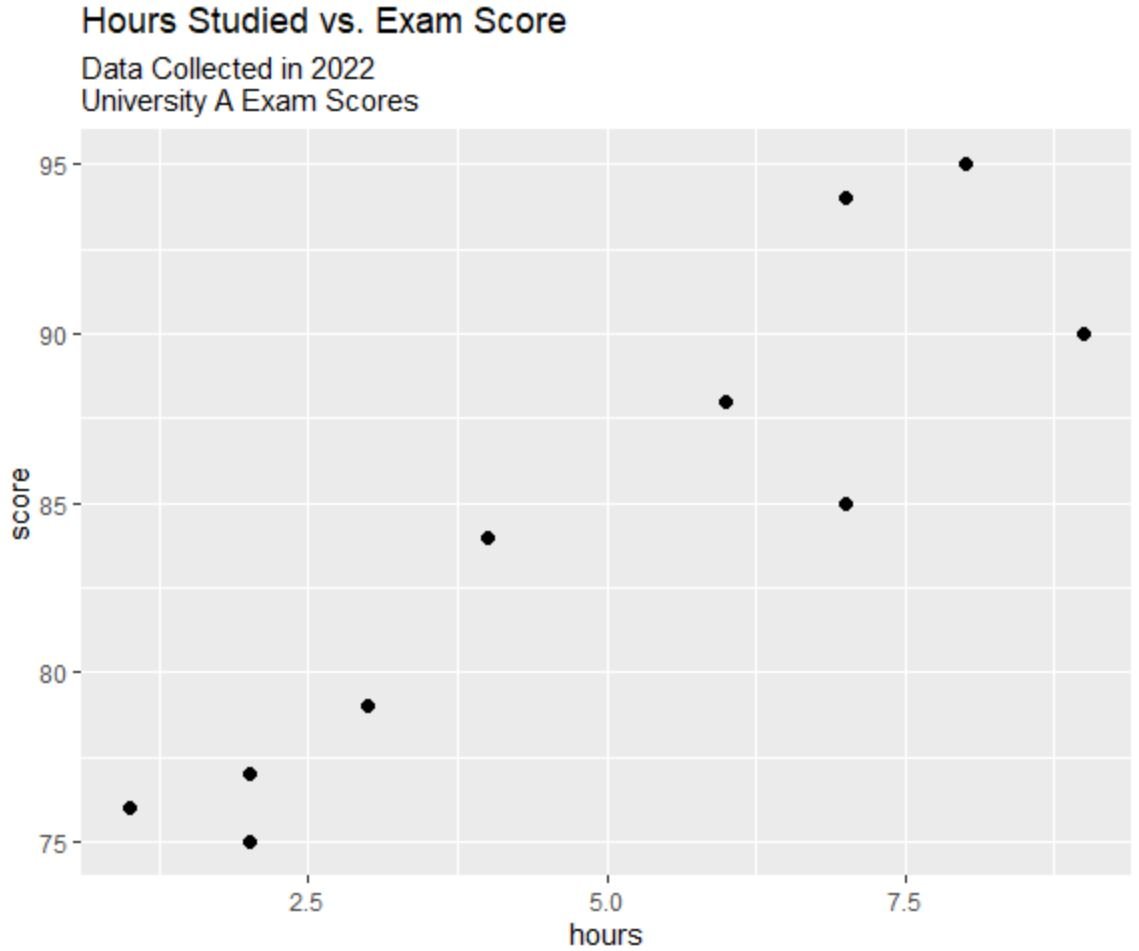
By using the line break syntax ( n ) we are able to create a multi-line subtitle.
Example 3: Add Subtitle with Custom Font
The following code shows how to use the theme() function in ggplot2 to add a subtitle with a custom font size, style, and color:
library(ggplot2)

#create scatter plot with subtitle that has customized font
ggplot(df, aes(x=hours, y=score)) +
  geom_point(size=2) +
  labs(title='Hours Studied vs. Exam Score',
       subtitle='Data Collected in 2022nUniversity A Exam Scores') +
  theme(plot.subtitle=element_text(size=18, face='italic', color='red'))
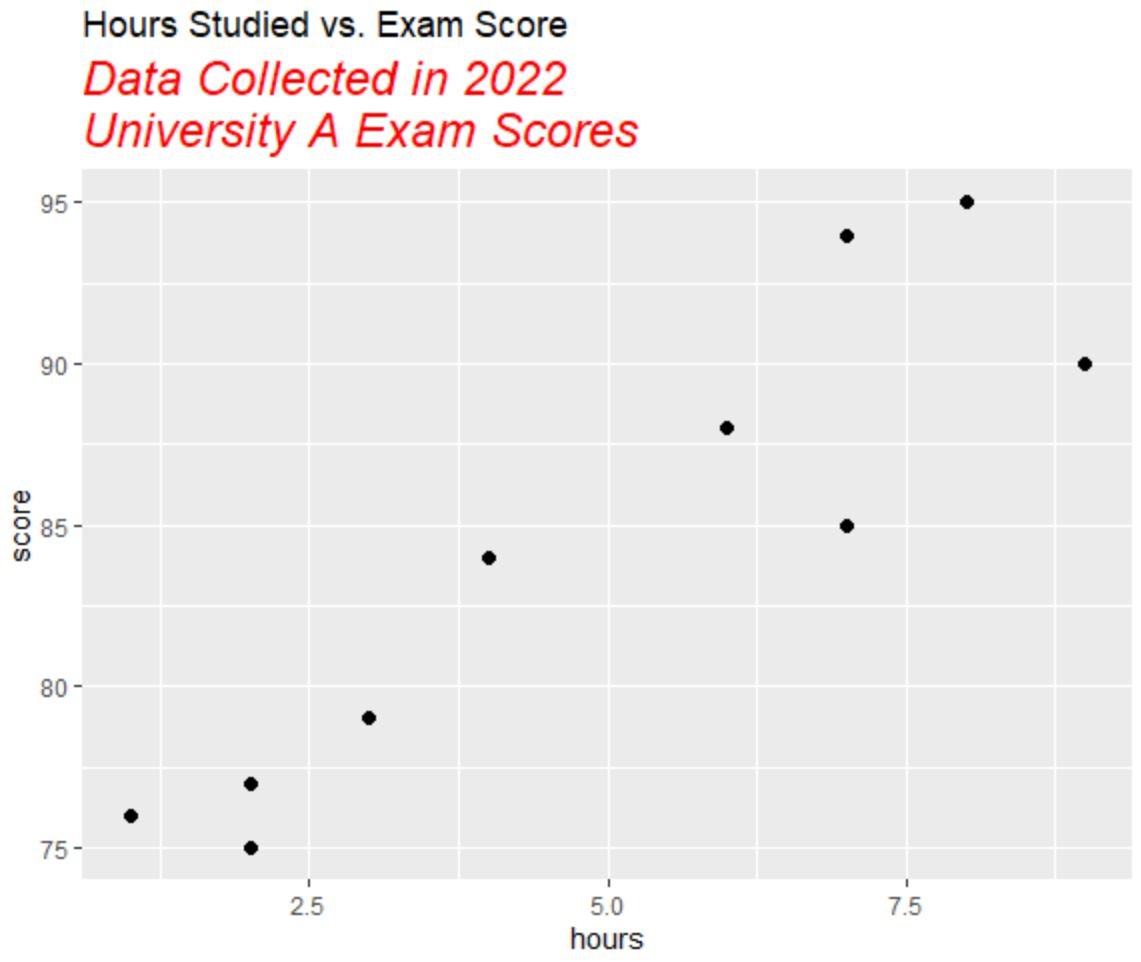
Notice that the subtitle now has a font size of 18, an italic style, and a red color.
Note: You can also use face=’bold’ to use a bold font style.
Additional Resources
The following tutorials explain how to perform other common tasks in ggplot2:
How to Add Caption to ggplot2 Plots
How to Change Font Size in ggplot2
How to Remove a Legend in ggplot2
How to Rotate Axis Labels in ggplot2