The 90th percentile of a dataset is the value that cuts off the bottom 90 percent of the data values from the top 10 percent of data values when all of the values are sorted from least to greatest.
To find the 90th percentile of a dataset in Google Sheets, you can use one of the following two functions:
- =PERCENTILE(data, percentile)
- =PERCENTILE.INC(data, percentile)
Both functions will return the same value.
For both functions, the data is the list of values in your dataset and percentile is the percentile you’d like to find between 0 and 1.
To find the 90th percentile, we will use 0.9 for k.
Note that there is also a function called =PERCENTILE.EXC that calculates percentiles between 0 and 1, exclusive. This function is rarely used in practice.
The following example shows how to calculate the 90th percentile of a dataset in Google Sheets.
Example: Calculating the 90th Percentile in Google Sheets
Suppose we have the following dataset that shows the exam scores of 20 students in a particular class:

We can use the following formula to find the 90th percentile of the exam scores:
=PERCENTILE(A2:A21, 0.9)
The following screenshot shows how to use this formula in practice:
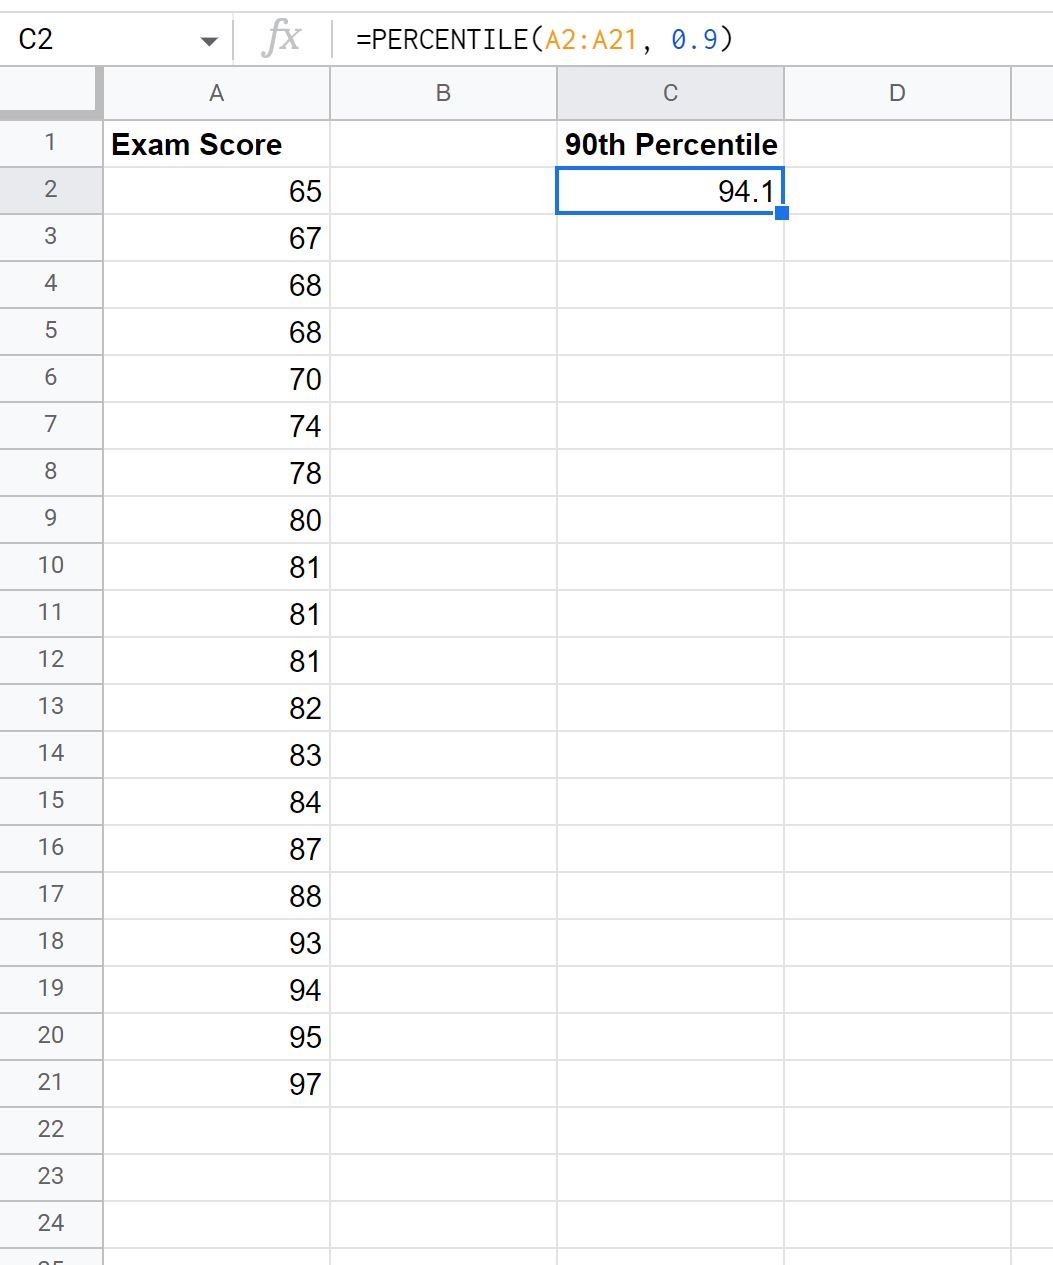
The 90th percentile turns out to be 94.1.
This is the score that a student must receive in order to have a score that is greater than 90% of the exam scores in the entire class.
Notes
Keep in mind the following notes when calculating percentiles in Google Sheets:
- The value for percentile must always be between 0 and 1.
- The percentile function will display a #VALUE! Error if you enter a non-numeric value for k.
- The data in our example was sorted from lowest to highest exam scores, but a dataset does not need to be pre-sorted in this manner for the percentile function to work.
Additional Resources
The following tutorials explain how to perform other common tasks in Google Sheets:
How to Calculate Deciles in Google Sheets
How to Use a Percentile IF Formula in Google Sheets
How to Calculate a Weighted Percentage in Google Sheets