You can use the set_title() function from matplotlib to add a title to a table created from a pandas DataFrame:
ax.set_title('Some Title')
The following example shows how to use this function in practice.
Example: Add Table Title to Pandas DataFrame
Suppose we have the following pandas DataFrame that shows the points and assists for various basketball teams:
import pandas as pd

#create DataFrame
df = pd.DataFrame({'team': ['A', 'B', 'C', 'D', 'E', 'F', 'G', 'H'],
                   'points': [18, 22, 19, 14, 14, 11, 20, 28],
                   'assists': [5, 7, 7, 9, 12, 9, 9, 4]})

#view DataFrame
print(df)

  team  points  assists
0    A      18        5
1    B      22        7
2    C      19        7
3    D      14        9
4    E      14       12
5    F      11        9
6    G      20        9
7    H      28        4
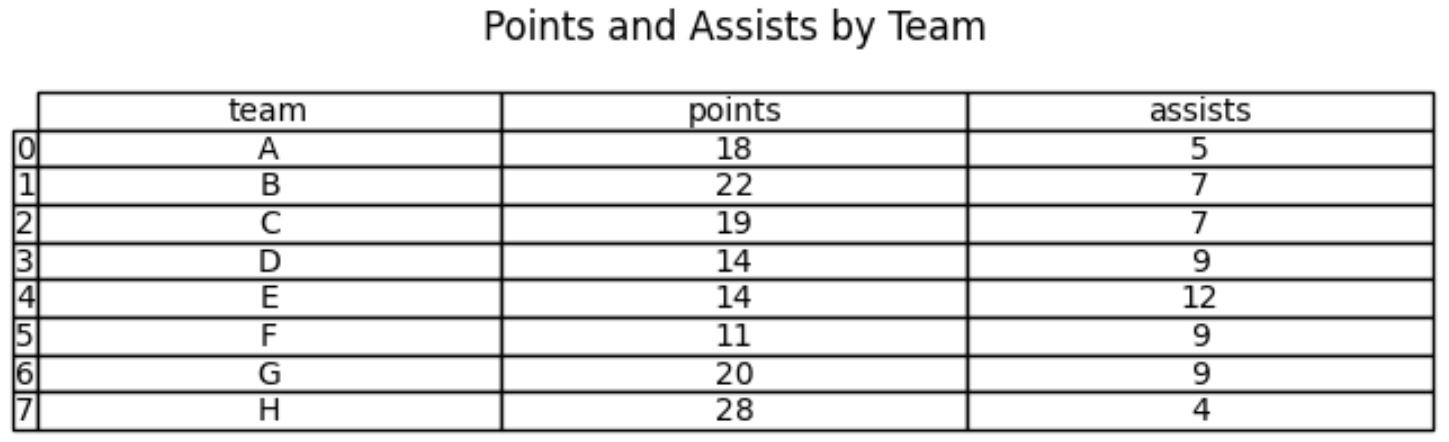
We can use the following code to create a table in matplotlib that displays the values from the DataFrame and use set_title() to specify a title for the table:
import matplotlib.pyplot as plt

#initialize figure
fig = plt.figure(figsize = (8, .2))
ax = fig.add_subplot(111)

#create table
ax.table(cellText = df.values, rowLabels = df.index,
         colLabels = df.columns, cellLoc='center')

#add title to table
ax.set_title('Points and Assists by Team')

#turn axes off
ax.axis('off')
Note: You can find the complete documentation for the table() function in matplotlib here.
Notice that the title ‘Points and Assists by Team’ has been added above the table.
Also note that you can use the fontdict and loc arguments to modify the title font and title location:
import matplotlib.pyplot as plt

#initialize figure
fig = plt.figure(figsize = (8, .2))
ax = fig.add_subplot(111)

#create table
ax.table(cellText = df.values, rowLabels = df.index,
         colLabels = df.columns, cellLoc='center')

#add title to table
ax.set_title('Points and Assists by Team',
              fontdict={'fontsize': 20,
                        'fontweight': 'bold',
                        'color': 'steelblue'},
              loc='left')

#turn axes off
ax.axis('off')
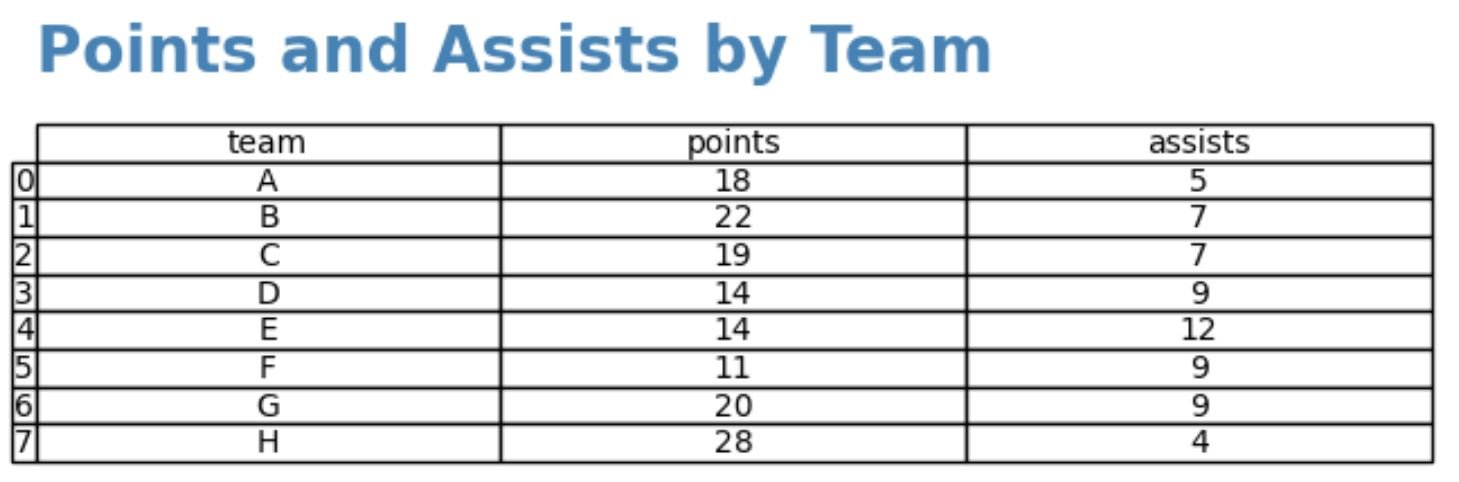
Notice that the title font is now larger, bold, left-aligned, and blue.
Refer to the matplotlib documentation for a complete list of ways you can modify the appearance of the title.
Additional Resources
The following tutorials explain how to perform other common operations in pandas:
How to Add Titles to Plots in Pandas
How to Make a Scatterplot From Pandas DataFrame
How to Create a Histogram from Pandas DataFrame