You can use the following basic syntax to rotate the axis labels in a plot in seaborn:
my_plot.set_xticklabels(my_plot.get_xticklabels(), rotation=45)
The following example shows how to use this syntax in practice.
Example: How to Rotate Axis Labels in Seaborn Plot
Suppose we have the following pandas DataFrame that contains information about the points scored by basketball players on various teams:
import pandas as pd

#create DataFrame
df = pd.DataFrame({'team': ['Mavericks', 'Mavericks', 'Mavericks',
                            'Mavericks', 'Warriors', 'Warriors',
                            'Blazers', 'Blazers', 'Kings',
                            'some_really_really_long_name'],
                   'points': [22, 14, 9, 7, 29, 20, 30, 34, 19, 12]})

#view DataFrame
print(df)

                           team  points
0                     Mavericks      22
1                     Mavericks      14
2                     Mavericks       9
3                     Mavericks       7
4                      Warriors      29
5                      Warriors      20
6                       Blazers      30
7                       Blazers      34
8                         Kings      19
9  some_really_really_long_name      12
We can use the countplot() function in seaborn to create a plot that displays the count of each team in the DataFrame:
import seaborn as sns

#create seaborn countplot
my_plot = sns.countplot(data=df, x='team')

Since one of the team names is extremely long, it overlaps another team name on the x-axis.
To get around this, we can use the following code to rotate the x-axis labels:
import seaborn as sns

#create seaborn countplot
my_plot = sns.countplot(data=df, x='team')

#rotate x-axis labels
my_plot.set_xticklabels(my_plot.get_xticklabels(), rotation=45)

Notice that each of the x-axis labels are now rotated 45 degrees.
If we’d like, we can also use the horizontalalignment argument to shift the x-axis labels to the left:
import seaborn as sns

#create seaborn countplot
my_plot = sns.countplot(data=df, x='team')

#rotate x-axis labels
my_plot.set_xticklabels(my_plot.get_xticklabels(), rotation=45,
                        horizontalalignment='right')
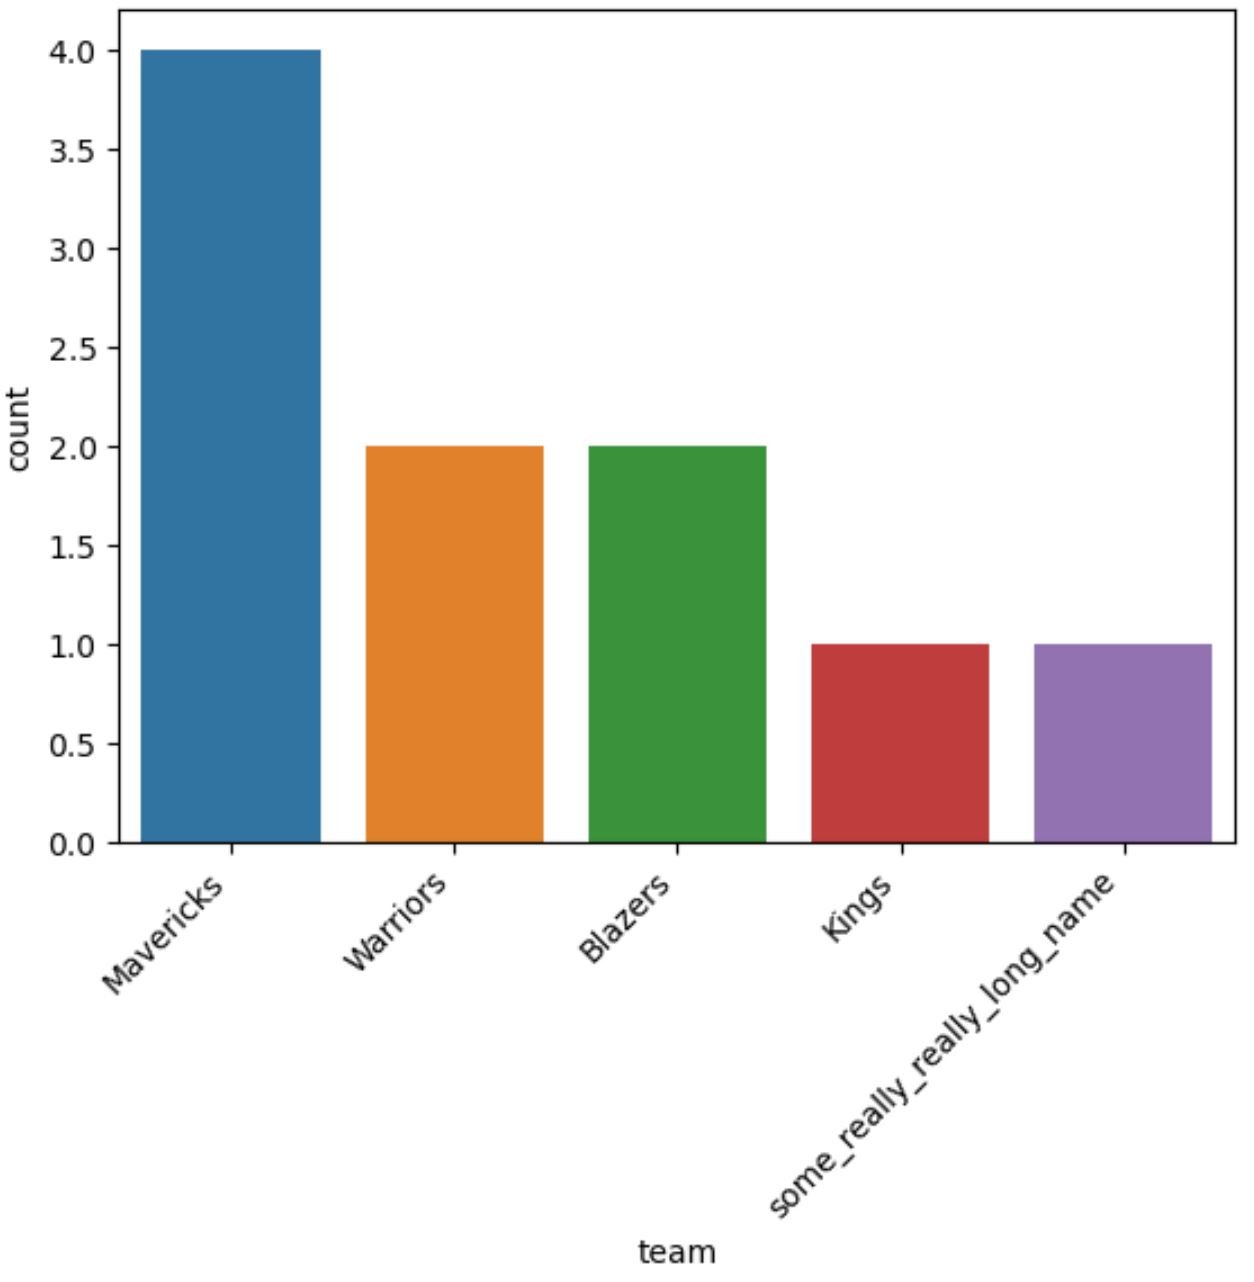
Each of the x-axis labels are rotated 45 degrees and shifted to the left.
Note: If you have trouble importing seaborn in a Jupyter notebook, you may first need to run the command %pip install seaborn.
Additional Resources
The following tutorials explain how to perform other common tasks in seaborn:
How to Add a Title to Seaborn Plots
How to Change Font Size in Seaborn Plots
How to Adjust the Figure Size of a Seaborn Plot